Propeller Injuries Up 65 Percent in USCG 2013 Statistics
16 June 2014 UPDATE – According to corrected USCG statistics propeller injuries were actually slightly down. Below we will explain how the error was identified, corrected, and why we kept this post
History of this Post
We created and posted this article on 23 May 2014 based on the then recently released U.S. Coast Guard annual Recreational Boating Statistics for 2013.
Events Leading to Discovering the Error
On June 3, 2014 we forwarded a link to the post to the U.S. Coast Guard Office of Boating Safety to make sure they were aware of the spike in boat propeller injuries.
The next day, June 4, 2014 USCG responded, said they were concerned about the spike in propeller accidents and they have an ongoing project looking at trends in accidents of various types.
On June 11, 2014, a reporter asked me some questions about current annual boat propeller accident statistics. I read him the 2013 data we had recently posted on our Statistics page and told him I would send him a link to the same data as presented by the Coast Guard.
When I went to the Coast Guard Office of Boating Safety web site and downloaded the 2013 Recreational Boating Statistics report and was looking for the page number to point him to the data, I noticed the data had changed. I quickly checked the copy we had downloaded previously to make sure I had not made an error in transcribing the propeller accident data, the data was definitely different.
I sent the reporter a link to the report and told him I was confused. I did not know which data set was correct, but that I would ask USCG and they would respond, but possibly not by his deadline.
That same day I sent USCG an email saying we noticed the data for the struck by boat and the data for the struck by propeller row had been swapped and asked about the changes in the data.
Monday 16 June 2014 USCG responded and said they had originally mistakenly swapped the two rows of data. The error had been corrected, and an updated version of the report was now available (the same one I “found” on 11 June.
I thanked USCG for explaining what happened and told them I totally understand how easy it would be to swap some data rows in the annual statistics report.
Why we left this post up
This error is emblematic of a much larger problem. We cannot see the data behind the annual recreational boat statistics report. Many states no longer make their data available to the Public version of BARD. We need access to that data for a multitude of reasons and will leave this post up to demonstrate this reason (we cannot confirm data in the annual report).
We posted a copy of Version 2 of USCG’s Table 17 immediately below (the corrected version). We labeled it as Version 2 in red at the top.
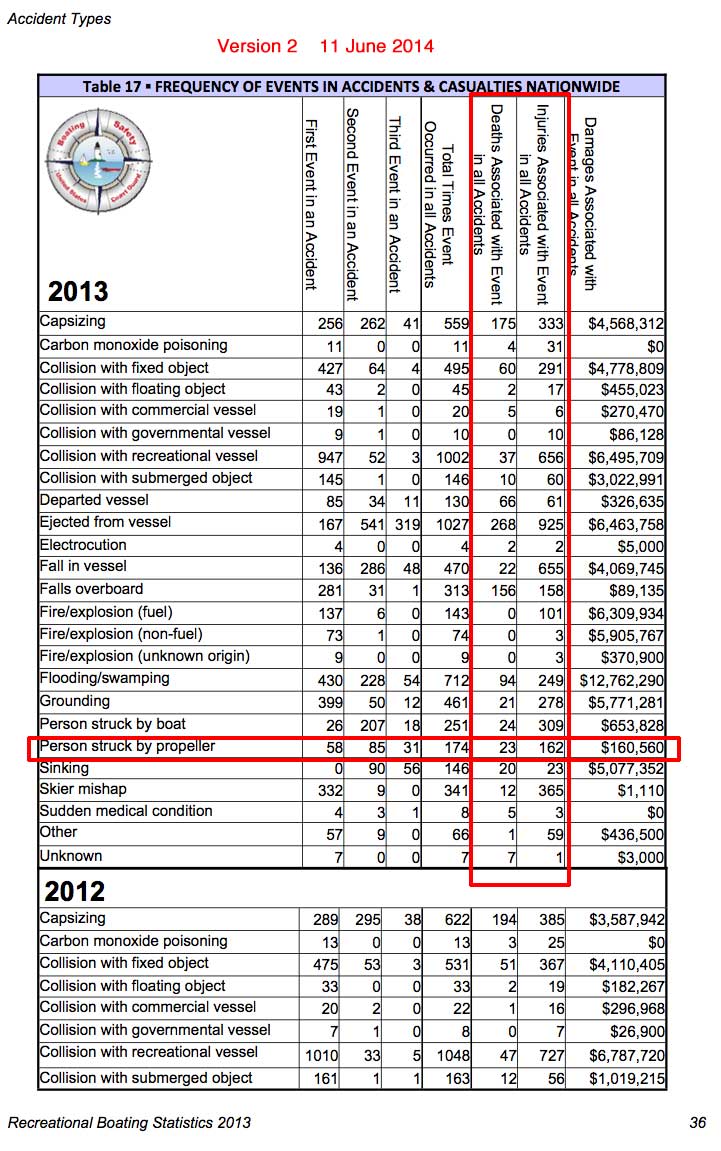
U.S. Coast Guard 2013 Recreational Boating Statistics Table 17, version 2 (as captured 11 June 2014)
You can see the rows for struck by boat and struck by propeller swapped data compared to the same table in our original post below.
****************************************
Below is our original post
NOTE – the calculations below are based on the WRONG data
(before USCG corrected the error)
************************************************************
The annual 2013 U.S. Coast Guard Boating Statistics report released in May 2014 indicates a 65 percent increase in boat propeller injuries compared to 2012. Boat propeller accidents and fatalities also increased significantly.
2013 USCG recreational boat propeller accident data, as seen in the table below, reports 251 boat propeller accidents resulting in 309 injuries and 24 deaths.
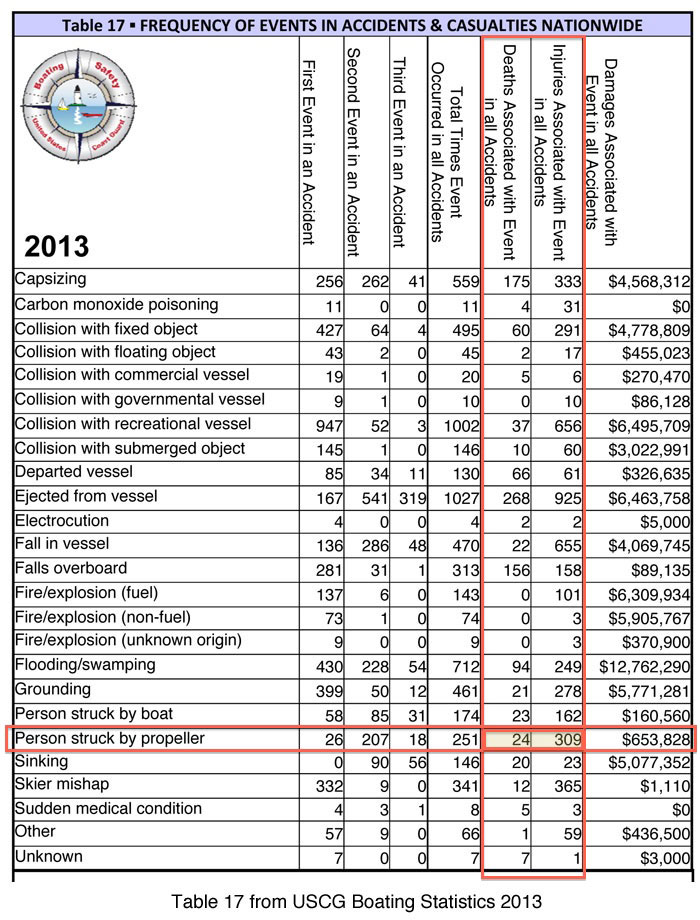
U.S. Coast Guard Recreational Boating Statistics 2013 table 17
The same table for 2012 data, as seen below, reported 181 accidents, 187 injuries, and 19 fatalities.
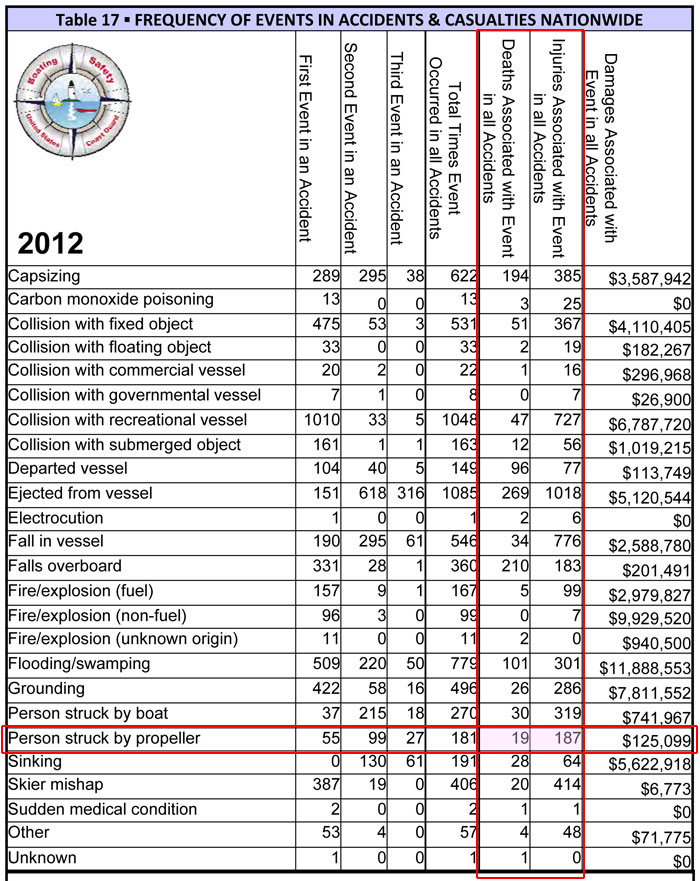
Table 17 from USCG Boating Statistics 2012
Comparing 2012 data to 2013 data.
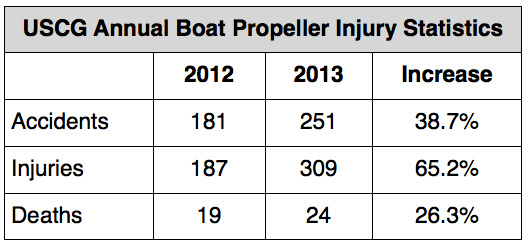
Comparison of USCG reported boat propeller accident statistics 2012 to 2013
The total number of USCG reported propeller accidents increased from 181 to 251 (70 more accidents), or a 38.7 percent increase.
The total number of USCG reported propeller injuries increased from 187 to 309 (122 more injuries), or a 65.2 percent increase.
The total number of USCG propeller fatalities increased from 19 to 24 (5 more fatalities), or a 26.3 percent increase.
Many boating safety professionals are still celebrating USCG reporting lowest number of annual total boating deaths from all causes ever recorded in 2013, and rightfully so. However, the huge spike in boat propeller accident, injuries, and deaths is being overlooked.
USCG recently sent us a copy of the U.S. Coast Guard Public Boating Accident Report Database (BARD) for 2013. We may be able to better address the increase in boat propeller accidents, injuries, and fatalities after we are able to spend some time with the actual database.
We strongly encourage other boating media to call attention to the huge spike in boat propeller injuries and the need to be vigilant, especially with Memorial Weekend just days away.
Event data, if anyone gets confused by Event 1 data, or the process USCG uses to record boating accidents as a sequence of three events, please view our coverage of the 2012 report.