Newspapers, magazines, and boating industry publications often significantly under report U.S. Coast Guard (USCG) recreational boat propeller accident, fatality, and injury statistics.
For example, right now (mid 2008) many publications are reporting USCG 2007 U.S. recreational boat propeller accident statistics as 80 propeller accidents which resulted in 75 injuries and 7 deaths, when the USCG actually reports there were 176 accidents resulting in 166 injuries and 24 deaths. Over twice as many people were injured and over three times as many people were killed as is being indicated in many publications. These errors result from writers not properly understanding USCG accident statistics tables.
If you publish the low numbers by error, your readers may underestimate their risk of propeller injury, take feel no action to protect themselves, and be injured or killed as a result. If you have published the incorrect information, please read the explanation below and issue a correction.
USCG accumulates boating accident reports in their Boating Accident Reporting Database (called BARD). They accept submissions from states for some period of time after the end of the year, then they close that year’s database. Safety professionals and industry representatives use the actual database, while the media usually relies on the annual summary published by the USCG titled, “Recreational Boating Statistics”. 2007’s annual summary can be viewed on the USCG web site.
Boating accidents typically occur as sequence of events, such as:
- Event 1 – one boat strikes another boat
- Event 2 – someone falls overboard
- Event 3 – that person is struck by the propeller
The Coast Guard logs these events in sequence as Event 1, Event 2, and Event 3. The annual Recreational Boating Statistics publication indicates the number of accidents of a specific type occurring as Event 1, Event 2, Event 3, and the total number of those accidents. Typically, most propeller accidents occur as Event 2. People fall overboard and are then “struck by motor/propeller”.
For many years this USCG has identified the sequence of events as Event 1, Event 2, and Event 3. Their 2007 annual summary now refers to these three events as Primary Event, Secondary Event, and Tertiary Event.
Please note the actual Coast Guard description of propeller accidents is “Struck by Motor/Propeller” as it is sometimes difficult to tell if a person was hit by the drive or by the propeller or by both. Injury statistics are the number of people who required treatment beyond first aid.
When reporting total annual U.S. propeller accident, injury and death statistics, PLEASE report the total of the three events, not Event 1 data.
Also please note that if you are reporting USCG propeller accident, injury and death data for a specific state, the same is true. Many reporters are only reporting Event 1 data and claiming it represents the total number of people struck by propellers in their state. See the New Jersey example provided later in this guide as an example.
If you do not believe us, please study the tables below. If you are a journalist and still do not believe us please contact the U.S. Coast Guard Office of Boating Safety. Their phone number and email addresses are not easily available, if you contact us we can provide them to you.
Some highlighted tables from the USCG 2007 Recreational Boating Statistics publication are provided below to point out the various event and total statistics.
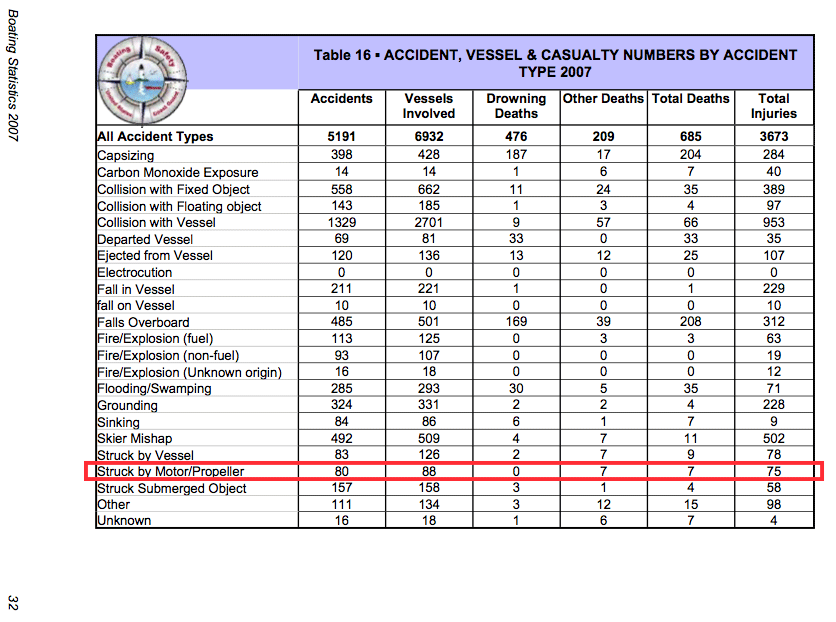
Table 16 (Page 32) of USCG 2007 Recreational Boating Statistics
EVENT 1 Accident Table – this is Event 1 data only!
Many writers think this Table 16 represents all propeller accidents, deaths and injuries and mistakenly report there were 80 propeller accidents, 75 propeller injuries, and 7 propeller deaths in 2007.
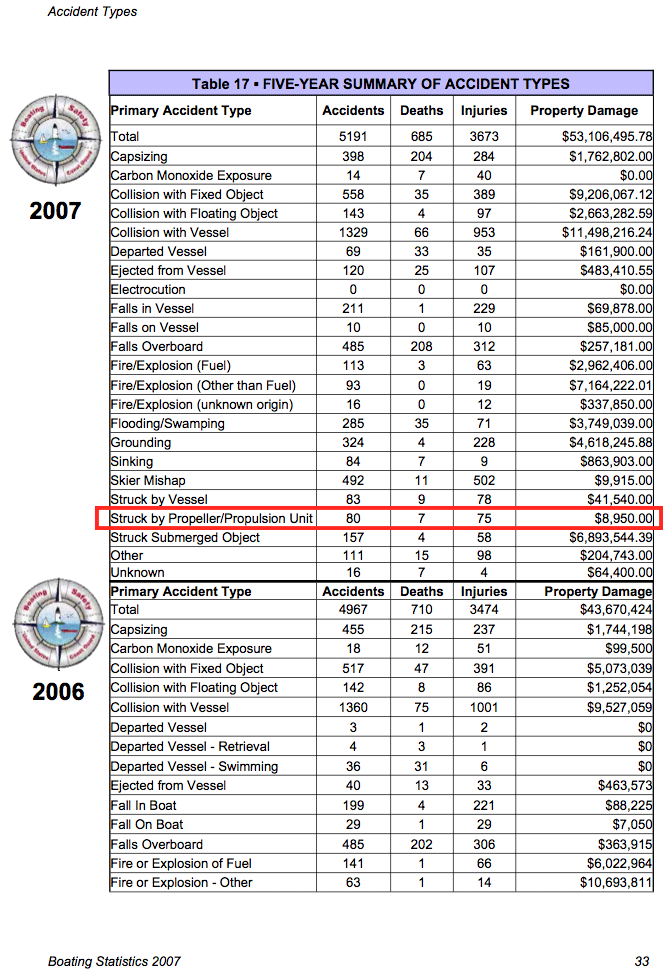
Table 17 (Page 33) of USCG 2007 Recreational Boating Statistics
2007 EVENT 1 data in 5 Year Summary Table – this is Event 1 data only!
Once again, many writers think Table 17 represents all propeller accidents, deaths and injuries and mistakenly report there were 80 propeller accidents, 75 propeller injuries, and 7 propeller deaths in 2007.
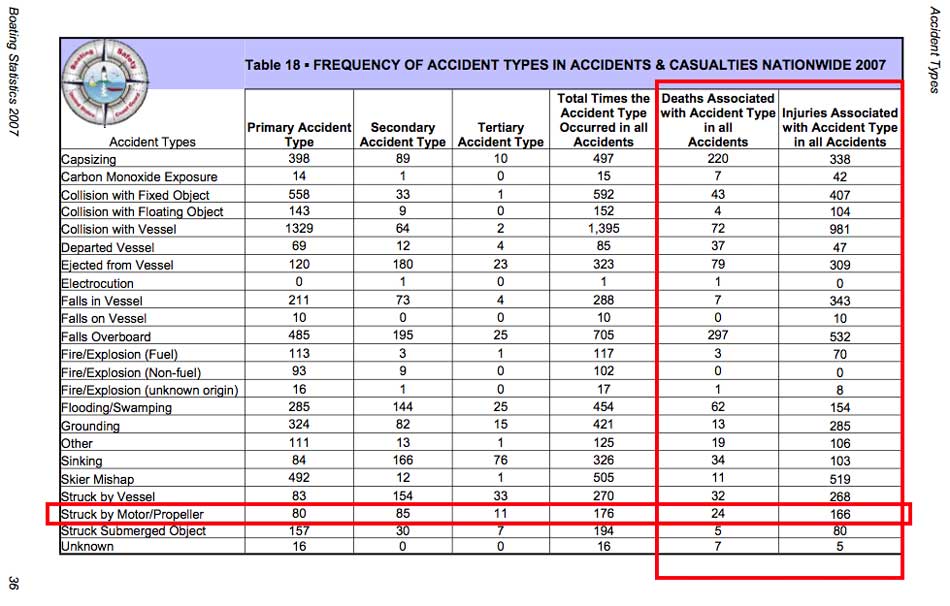
Table 18 (Page 36) of USCG 2007 Recreational Boating Statistics
2007 EVENT 1, EVENT 2, EVENT 3 data plus Total Number of Accidents Plus total Deaths and Injuries.
The 24 deaths and 166 injuries shown in Table 18 are the total number of recreational boat deaths and injuries in 2007 categorized as “Struck by Motor/Propeller” per the USCG report. This is the correct number of deaths and injuries as reported by the USCG.
Accident Data for Individual States
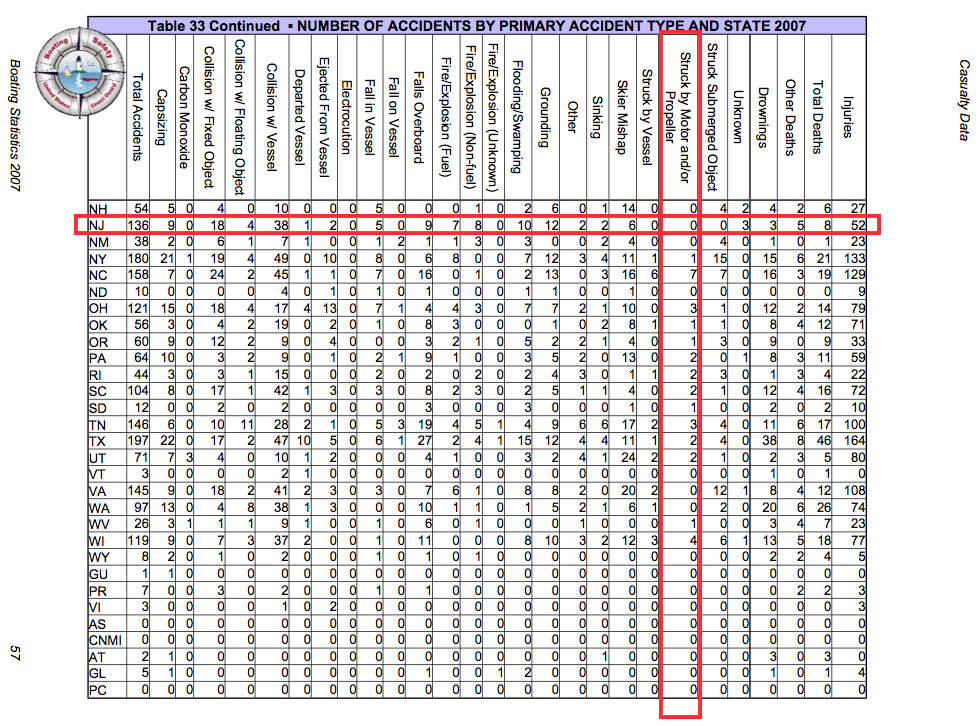
Table 33 (Page 57) of USCG 2007 Recreational Boating Statistics
2007 EVENT 1 data for individual states. New Jersey is marked as an example. This is EVENT 1 data only!
Many writers think Table 33 represents all propeller accidents in their state in 2007. It does NOT, it only represents EVENT 1 accidents. Note the title of the table clearly states there are the “Number of Accidents by PRIMARY ACCIDENT Type” (Event 1 type).
To obtain the total number of reported accidents, injuries, and deaths for a specific state due to “Struck by Motor/Propeller” you will need to access the actual BARD database OR check with your state reporting agency.
We did the State of New Jersey as an Example:
The Table 33 above shows no (0) Event 1 propeller accidents but gives no indication of the number of Event 2 or Event 3 accidents. We searched the actual BARD database for Event 1, Event 2, and Event 3 “Struck by Motor/Propeller” accidents and found one Event 2 non fatal accident (BARD # 2007-NJ-0047 that occurred 21 July 2007 on Delaware Bay).
Then we searched our own database of media reported propeller accidents. We found the accident above, PLUS we found a 2 August 2007 propeller accident near Long Beach Island in which a man was ejected from a boat and killed by the propeller of the circling boat. We went back to the BARD database and found this accident (BARD # 2007-NJ-0071) listed as a fatal accident, BUT none of the Event types listed “Struck by Motor/Propeller”. That particular accident only had an entry for Event 1 and that was listed as Ejected from boat. We then searched the BARD deceased database table and found the gentleman listed as deceased. The deceased table has a separate column for listing as being a propeller injury. That column was marked, meaning this man was struck by the propeller even though it is not labeled as such over in the Events area.
Bottom line is there were one injury and one fatality as a result of being struck by the motor or propeller in New Jersey in 2007 per the USCG BARD database.
If you have published the wrong numbers, please correct your state data so your citizens are aware of their risk per the USCG data.
Again, if no one believes us, The July 21, 2007 accident was reported on NJ.com as a 23 July 2007 story in the South Jersey News Online titled, “Pa. Man Falls From Boat, Seriously Injured by Propeller.” The August 2, 2007 accident is reported in the Asbury Park Press on 4 August 2007 in a story titled, “Boater Killed in Accident on Bay Was Tuckerton Man.” Both stories were also covered by other media sources. If you cant find them, we can fax you a copy.
We appreciate reporters covering boating safety news and encourage them to correct any errors they make in reporting USCG propeller accident statistics.
If You Still Think Event 1 Statistics Represent All the Propeller Strikes
A quick look at our log of propeller accidents reported in the media in 2007 along with links to many of those articles should rapidly make it apparent there were MANY more deaths and injuries than present in Event 1 stats.
See our 2007 Media Reported Propeller Accidents page available under the Accidents tab in our navigation bar. Each red “D” represents a U.S. fatality.
If you are a journalist and still do not believe us, please contact us and we will put you in contact with the U.S. Coast Guard Office of Boating Safety and they will explain the statistics to you.
You Are Not Alone: Others Have Made This Mistake Before
Many writers have used Event 1 data to represent all boating accidents in the past. We try to contact them, point out the proper data, and encourage them to write a correction indicating the actual number of propeller deaths and injuries reported by the U.S. Coast Guard. Many respond and correct their publications, some say they will next time, a few refuse to believe us and continue to print the wrong information.
Please print/post a correction if you have posted a story incorrectly interpreting the USCG propeller accident statistics so this error does not perpetuate itself. Thank you.
Prologue
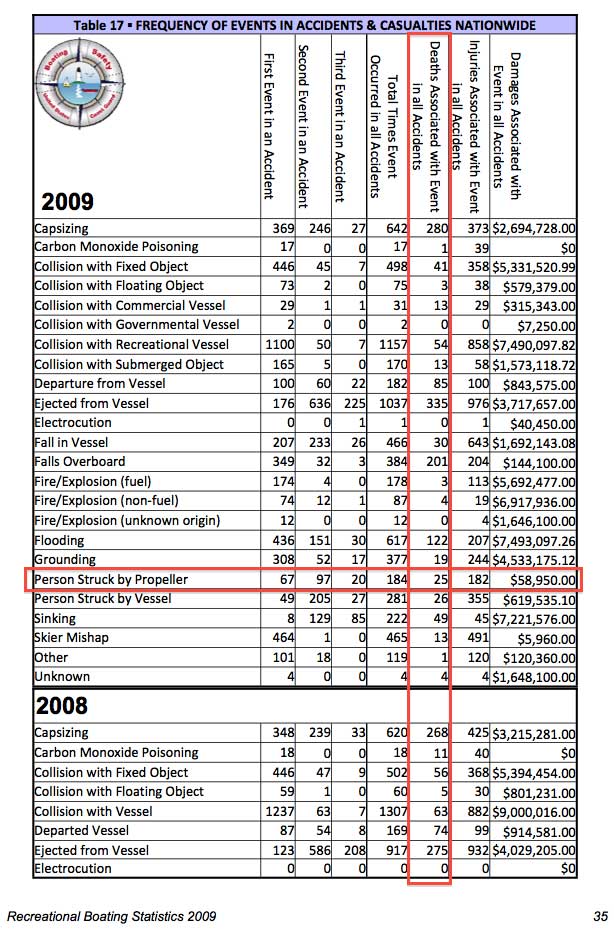
In response to input from PGIC and SPIN, USCG modified Table 17 in their 2009 Recreational Boating Statistics report to a variation of a format we suggested. The new Table 17 format includes Event 1, Event 2, Event 3, and Total Event data that should reduce confusion in the future.
Table 17 (Page 35) of USCG 2009 Recreational Boating Statistics
2009 Event 1, Event 2, Event 3, Total Events, and Total Fatalities Data
Comparing 2009’s Table 17 (above) with 2007’s Table 17 (shown further above) you can see improvements have been made to lessen the confusion. However, Table 16 remains unchanged and may still mislead some readers.
Under Reporting of Propeller Accidents
We would be remiss if we did not also point out many feel the USCG propeller accident data is vastly under reported. Many studies have shown that to be true you can see several studies listed near the bottom of the our Propeller Accident Statistics page, plus we are aware of several accidents that are not reported in BARD.
The USCG does the best they can, but they have to rely on states to capture the data and send it in. It just flat does not happen all the time. A few years
ago the USCG openly said they thought only about 10 percent of all boating accidents were reported. They did say more severe accidents are more likely
to be reported and they think almost all fatalities are reported. Boating industry representatives say they think most propeller accidents would be severe and thus they are almost all reported, but we disagree.
Questions & Feedback
If you have any comments or questions about the statistics of other information on this site, or feedback about the site, please contact us.
