Boat Kill Switch Wear Rate Estimated from U.S. Coast Guard BARD Data
In June 2011, the U.S. Coast Guard published an Advanced Notice of Proposed Rulemaking (ANPR) titled Installation and Use of Engine Cut-Off Switches on Recreational Vessels USCG-2009-0206. Among other things, the ANPR requested public comments concerning a potential future proposed rule requiring operators of certain boats to wear kill switches (like lanyard kill switches that stop the engine if the boat operator is ejected). A few states have already enacted similar requirements.

Kill Switch Lanyard on Wrist – Image courtesy of U.S. Coast Guard
In response to the Coast Guard’s request, and several other projects, we decided to attempt to estimate kill switch wear rates from previously collected boat accident data in USCG’s Boating Accident Report Database (BARD).
BARD began collecting kill switch wear data on boat operators involved in reportable boat accidents in a separate data field in 2009. Prior to then, the redacted narrative (description of the accident) sometimes mentioned if one was used or not.
We limited our study to vessels identified as open motorboats in the accident reports.
2009 & 2010 BARD Data
In 2009, 2,336 open motorboats appear in BARD, of those only 452 report if the boat operator was wearing an engine cut-off switch or not. Of those, 91 were and 361 were not for a 20 percent wear rate.
In 2010, 1575 open motorboats appear in BARD, of those only 315 report if the boat operator was wearing an engine cut-off switch or no. Of those, 41 were and 274 were not for a 13 percent wear rate.
We suspect these initial estimates are too high.
Note – we recognize the writing of this post is pretty ragged as we have added to it several times through the years. Hopefully we will have time to clean it up sometime.
Discussion of Initial Findings
2009 was the first year USCG collected boat operator kill switch data. The collection rate was low (data on 452/2336 = 19 percent of all open motorboat accidents) but they were not able to significantly build upon those rates in 2010 (315/1575 = 20 percent).
2010 also saw a large number of states refusing to supply their data to public BARD citing privacy issues so the total number of accidents were were able to review drastically decreased (from 2336 open motorboats to 1575 open motorboats).
We suspect three problems taint our initial estimates.
- The likelihood of having an entry for the boat operator wearing a lanyard or not is probably not random. We suspect those wearing kill switches are more likely to report or insist it be reported than those not wearing a lanyard. Officers in the field themselves may be more likely to report when one was used than they are to report when one was not. Therefore accidents in which the operator was wearing a kill switch are probably more likely to have an entry in that data field, than accidents in which the operator was not wearing a kill switch. This effect would indicate our initial estimate might be considerably high.
- Many boat accidents are self reported (either by directly filing out the form, or by relating the event to an officer). Some boaters may report they were wearing kill switch lanyards when they were not actually wearing one. This effect could artificially raise our estimate.
- Boat operators that wear kill switches may be safer boaters and thus less likely to be involved in a boating accident than non-wearers. This effect could artificially lower our estimate
We suspect the first problem listed (greater likelihood of an accident in which the boat operator was using a lanyard to be reported that he or she was wearing one than the likelihood of a similar accident in which the boat operator was not wearing one to be reported that he or she was not wearing one) has the most impact on our initial estimates.
We thought of a way we might check for these effects. The same three problems would probably similarly taint life jacket / PFD wear rates similarly estimated from BARD data. There are several known estimates of life jacket wear rates we could compare our findings to. We could use those findings to “adjust” our initial kill switch wear rate estimates.
Estimating Life Jacket / PFD Wear Rates from BARD Data
Using the same process we did for kill switches, we found:
In 2009, 2,336 open motorboats appear in BARD, of those only 432 report if the boat operator was wearing a PFD or not. Of those, 116 were and 316 were not for a 27 percent wear rate.
In 2010, 1,575 open motorboats appear in BARD, of those 867 report if the boat operator was wearing a PFD or not. Of those, 328 were and 539 were not for a 38 percent wear rate.
PFD Data Discussion
The U.S. Coast Guard continues to promote wearing life jackets and has used contractors to collect life jacket wear rates from field observations. It looks like USCG probably emphasized collecting life jacket data in BARD in 2010 because the data collection for boat operators jumped from 18 percent (432/2336) in 2009 to 55 percent (867/1575) in 2010.
Averaging 2009 and 2010 PFD wear rates (27 percent + 38 percent)/2 = 32.5 percent
Actual national open motorboat PFD wear rates for adults are usually about 5 percent. IF open motorboat operator PFD wear rates mirror national open motorboat adult PFD wear rates, our BARD generated estimates is about six times higher than the actual rate.
We suspect that multiplier is due to the three “problems” we mentioned earlier, and probably most of it could be attributed to the first problem we listed (over reporting of those wearing PFD’s compared to reporting rates of those not wearing PFDs).
How Does This Effect Our Initial BARD Generated Kill Switch Wear Rates
Our earlier 2009 and 2010 estimates average to (20 percent + 13 percent)/2 = 16.5 percent
We calculated a multiplier of 6 in our PFD calculations. Some youth will be operators of these boats and be required to have worn a life jacket. If we arbitrarily back off the multiplier to 5 to account for those youth (required to use a PFD but not required to use a kill switch and some of them still not using the PFD anyway) we get a multiplier of 5.
If we reduce our estimate by a factor of five 16.5 percent / 5 = 3 percent
Our estimate is not very sensitive to reductions in the multiplier. If we went way down to a multiplier of 3, our estimate would only go up to about 5 percent (still in the range of PFD wear rates)
Our findings place kill switch wear rates in the neighborhood of boat operator PFD wear rates which we suspect is a reasonable estimate.
We are ABSOLUTELY NOT claiming 3 percent is a good valid estimate of kill switch wear rates. We are claiming it is one estimate. We need more data and estimates by others to begin honing in on the real wear rate.
2011 and 2012 BARD Data
Update 24 February 2014
We ran the same process on 2011 and 2012 BARD data.
2011 BARD included data on 2202 open motorboats
Kill switch data was supplied on 389 boats. 81 were using the switch, 308 were not.
81/389 = 20.8 percent kill switch wear rate.
Operator PFD status was reported on 1129 open motorboats. 320 were wearing, 809 were not.
320/1129 = 28.3 percent PFD wear rate.
2012 BARD included data on 2217 open motorboats.
Kill switch data was supplied on 398 boats. 109 were wearing, 289 were not.
109/398 = 27.4 percent wear rate.
Operator PFD status was reported on 1938 boats. 303 were wearing, 1635 were not.
303/1938 = 15.6 percent.
For some reason, from 2011 to 2012 BARD data, kill switch wear rates reported in BARD accidents increased 7.3 percentage points (20.1 to 27.4) while boat operator PFD wear rates in open motorboats involved in any kind of a BARD reported accident decreased 12.7 percentage points (28.3 percent to 15.6 percent).
BARD data for 2009, 2010, 2011, 2012 showed unadjusted kill switch wear rates of 20, 13, 20, and 27 percent.
Our earlier ideas of USCG being much more likely to report the wearing of PFD’s or of a kill switch than the “not wearing” of these devices needs some re-thinking at a future date. PFD wear rates are now being reported for a large percentage of the total number of accidents. For example BARD data for 2012 identifies if the operator was or was not wearing a PFD in 1635 of the 2217 reported accidents involving open motorboats (status reported in approaching 75 percent of the open motor boat accidents reported). That means, that even if there was a tendency to report good practices and not report bad practices, there is not a lot space for unreported bad practices (maximum of 25 percent more were not wearing PFD’s). It is not obvious why operator PFD wear rates in accidents are so much higher than observed wear rates of all on board. Later thoughts – perhaps many operators are the only person on board and more likely to wear a life jacket then as no one is around to come to their rescue or to poke fun at them for wearing a life jacket. That could make the operator PFD wear rate higher than the average adult wear rate of everybody on board all open motor boats. Or, operators may just self report they were wearing a life jacket when they were not.
2013 BARD Data
Update 29 May 2014
We ran the same process on the recently released 2013 Public BARD data.
2013 Public BARD included data on 1882 open motorboats
Kill switch data was supplied on 314 boats. 94 were using the switch, 220 were not.
94/314 = 29.9 percent kill switch wear rate.
Operator PFD status was reported on 1685 open motorboats. 267 were wearing, 1418 were not.
267/1685 = 15.8 percent PFD wear rate.
Now that we have five years of BARD data on kill switches being worn or not in accident reports, we will draw some charts when we have time. Current USCG BARD accident reports still only report kill switch status about 19 percent of the time (kill-switch data available on 314 of 1882 open motor boats in 2013 Public BARD). We encourage USCG to encourage the collection of kill switch wear information from a greater percentage of boat accidents (we are missing over 80 percent of the data from the fraction of BARD data that we can see). We also encourage USCG to collect more accurate kill-switch data from field observations and surveys.
2014 BARD Data
Update 1 September 2015
We ran the same process on 2014 Public BARD data.
2014 Public BARD included data on 2048 open motorboats
Kill switch data was supplied on 399 boats. 101 were using the switch, 298 were not.
101/399 = 25.3 percent kill switch wear rate.
Operator PFD status was reported on 967 open motorboats. 279 were wearing, 688 were not.
279/967 = 28.9 percent PFD wear rate. This is a big bounce from 2013’s rate of about 16 percent. it also a big drop in reporting percentages (about 700 fewer boats reported PFD status than in 2013).
Current USCG BARD accident reports still only report kill switch status about 20 percent of the time (kill-switch data available on 399 of 2048 open motor boats in 2014 Public BARD). We encourage USCG to encourage the collection of kill switch wear information from a greater percentage of boat accidents (we are missing over 80 percent of the data from the fraction of BARD data that we can see). We continue to encourage USCG to collect kill-switch wear rate data from field observations and surveys.
Wear Rate Table
Kill switch and PDF wear rates as directly estimated from BARD data are presented below. Please read all the qualifiers above. We know this data is not extremely accurate.
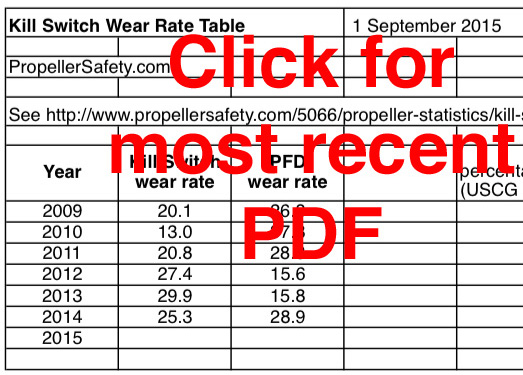
Kill Switch wear rate
Future Work in This Area
Field observation studies need to be made. We suggest they be made in conjunction with life jacket / pfd wear rate studies. The correlation between wearing one of the other or both would prove interesting.
We could remove the boats operated by youth from our calculations, but age is not supplied for every accident and removing them would lower our sample size.
We could look at some of the BARD data by state to see if some states only reported those that wore or only those that did not, and if wear rate calculations were reasonably the same over some of the more represented states (states with more boats). We could also examine wear rates for some of the states that currently require the operators of certain boats to wear kill switches, like the State of Alabama.
The problem with some of those calculations is sample size. With only about 20 percent of all accidents reporting kill switch wear rate status (if they are wearing or not), the sample size per individual states would be pretty small.
We encourage states to fill out this data field (wearing kill switch or not) in BARD.
If anybody has any existing data in this area, please share it with us.
If anybody is wondering why the Propeller Guard Information Center is writing about kill switch wear rates – we are interested in them because boat operators are often ejected, the boat goes into the Circle of Death, and the boat operator and/or passenger(s) are struck by the propeller.
Help Us
We welcome your comments and especially those from the boating industry. We encourage others to replicate our estimates directly from the BARD data. Directly use the BARD database, make your own calculations, and share any errors in our calculations you may find or any comments you may have.
Also, if anybody has any ideas of other ways to estimate wear rates, beyond direct visual surveys, and online/mail surveys, please share your ideas with us.