Rating Propeller Guards per USCG’s New Propeller Test Procedure: the Numbers
We examine the propeller guard Rating system and the numbers and data behind those Ratings as defined by the new U.S. Coast Guard (USCG) / American Boat and Yacht Council (ABYC) Propeller Guard Test Procedure.
The new propeller guard test procedure (originally called the Propeller Guard Test Protocol) assigns ratings (typically 0,1,2,3) to prop guards in each of four categories:
- Speed
- Maneuverability
- Ease of Installation
- Effectiveness
The procedure stresses it is for testing guards on a specific or unique boat. Comparisons between different guards will only be valid if they were tested “using an identical boat/engine combination.”
Speed Testing Ratings
Speed testing is performed on a boat with and without the guard. Under the specified conditions, the boat is ran at maximum RPM. The resulting speed and RPM are recorded. Per 8.2.4.1:
8.2.4.1 Following the procedures above, a speed rating can be determined. When determining the rating for speed, a degradation greater than or equal to 25% relative to an unguarded propeller shall be assigned a rating of ’1’, a degradation of between 10% and 25% shall be assigned a rating of ‘2’, and a degradation less than or equal to 10% (or an increase in speed) shall be assigned a rating of ‘3’.
The test also requires increasing RPM from idle to the nearest 500 RPM increment, then recording boat speed and RPM. Then increasing RPM in 500 RPM increments from there up and recording RPM and speed. We think the speed testing rating described in 8.2.4.1 applies only to the top speed ratings, however some earlier versions of the study also averages the percent in speed differences over the full range of settings.
In this rating, the larger the number, the less the speed degradation, and the better the guard. They use 1,2,3 as ratings (no zero is included in this rating). An open propeller would be Rated 3. If a guard had absolutely no degradation in speed, or even increased speed as some duct guards do on certain vessels, it would also be assigned a “3”.
The procedure does not specifically say you are allowed to trim the drive to reach maximum top speed.
Maneuverability Testing Ratings
Maneuverability testing consists of running a boat through a specified series of turns at specified low, medium and high speeds with and without a propeller guard at each of the three trim positions (in, default, out) while steering torque data is being collected. That requires three runs at each speed without a guard (one at each trim position) plus three runs at each speed with a guard (one at each trim position). A statistical test is performed to determine if the propeller guard significantly alters steering effort.
The resulting “p” value from the statistical test is used to rate the guard 1,2, or 3. Any peak measurement in the guarded condition above 27 Nm (newton meters) results in a rating of 0.
In this test, the larger the rating, the better the guard.
Ease of Installation Ratings
The test calls for beginning with the guard as packaged for resale, recording how long it takes to install the guard, and reporting if power tools were required for installation.
Guards are rated:
- 1 for requiring over one hour and power tools to install
- 2 for requiring over one hour but no power tools OR for requiring less than one hour but needing power tools
- 3 for requiring less than one hour and no power tools to install
In this test, the larger the rating, the better the guard.
The test does not mention if more than one person can be helping install the guard, and does not recognize that some guards can be installed from the water. Houseboats and other large vessels may have to be pulled from the water to install some guards. If they can be installed from the water, they offer significant savings in installation costs on larger vessels.
We interpret their mention of power tools to refer to drilling holes in the anti-cavitation plate or skeg. At least one drive (Yanmar) has an option of preformed holes for ring guards. Plus some might be hand drilled. If the procedure really mean “no drilling” they might say it.
Effectiveness Rating
We previously noted that testing the guards without a boat and without the propeller being powered has little relevance to real life. However, we are still going to discuss the ratings.
The procedure combines the SUNY testing into three groups:
- 15 mph
- 5 mph
- idle and reverse
They add up the number of strikes or impacts for each speed, divide it by the total number of tests at the speed, and convert the result to a percentage. Those percentages are then converted to a rating of 0,1,2,3. The resulting effectiveness percentage lookup chart copied from page 13 of the procedure.
Effectiveness Percentage Lookup Chart
- 0 to 25 percent = 3
- 26 to 50 percent = 2
- 51 to 75 percent = 1
- 76 to 100 percent = 0
As a result of the testing at SUNY, they produced Table 4 in the procedure as shown below.
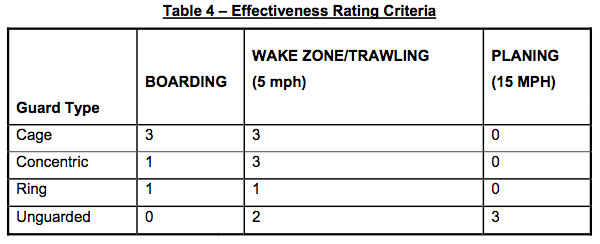
USCG Propeller Guard Test Procedure Table 4
For this test, the larger the number, the better the guard (per their testing).
Our Efforts to Reproduce Table 4
We spent a lot of time trying to reproduce Table 4 from the data available and quit in frustration.
Per our understanding, they called any kind of mark on the sample a “strike” so they just counted up every sample with a mark on it for a given guard at that speed, divided by the total number of runs at that speed for that guard, converted the result to a percentage, then looked up the Rating corresponding to that percentage on page 13 of the procedure (the effectiveness percentage lookup chart was replicated above).
At first we thought results of the individual runs for each propeller guard were provided in “The Effectiveness of Guards in Mitigating Propeller Strikes” by William Daley of CED, presented at IBEX, 29 September 2010. We thought each “dash” as shown in the images below at a specific distance represented “one” run unless labeled otherwise. That document is attached to the minutes for the USCG Accident Mitigation Workshop at IBEX September 29, 2010. We used it in an unsuccessful attempt to reconstruct Table 4 above.
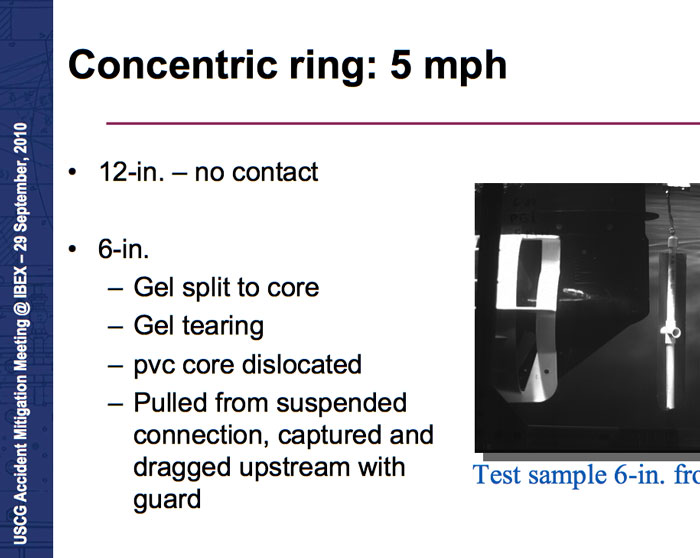
SUNY test Concentric Ring 5 mph
As we started trying to replicate Table 4 we noticed some guards and situations included both horizontal and vertically hung samples as shown in Concentric Ring parked-in-gear image below.
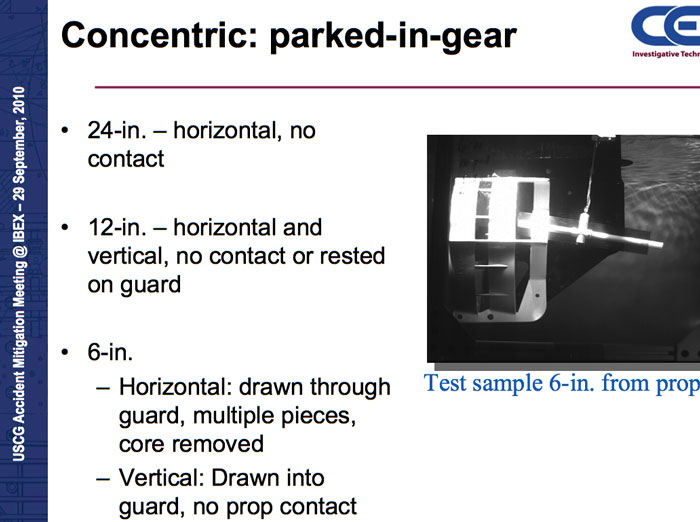
SUNY parked-in-gear
We decided to count vertical and horizontal tests as separate “runs”.
Boarding includes the data for both Parked-in-Gear (see Parked-in-Gear image above) AND the data for reverse (see the Concentric Ring Reverse image below)
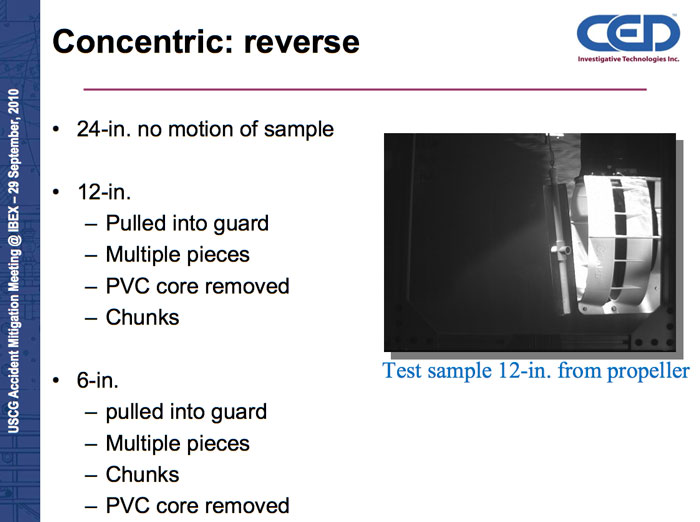
SUNY reverse Concentric Ring
We mentally combined the “Parked-in-gear” counts with the “Reverse” counts to obtain the newly defined “Boarding” count.
Then we found some images of struck samples that showed three samples that were struck when that particular guard and test only had one dash at that distance. That caused us to lose faith in our “one dash equals one run” theory.
Adding to our frustration in replicating Table 4:
- Test runs were made on multiple occasions including July 2010 and December 2010.
- Initially the samples were 3 inches in diameter. Some 10 inch diameter samples of two different lengths (16 inches and 30 inches) were ran in December 2010. Were we supposed to include those results as well?
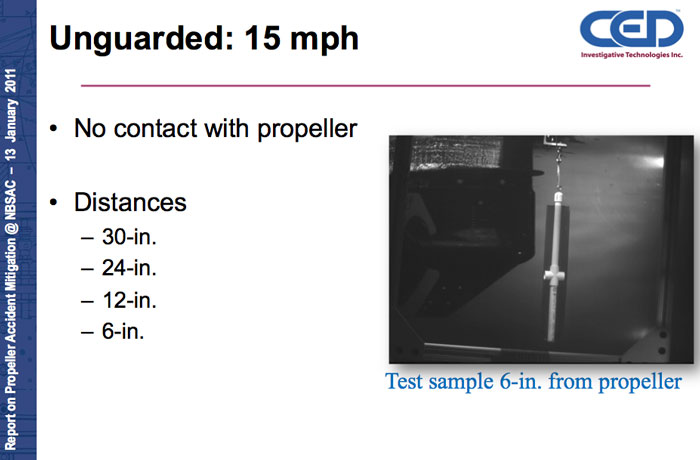
- Tests were ran at 6 inches, 12 inches, 24 inches, 30 inches. But not all units were tested at all distances. For example, we noticed open propellers were tested at all four distances on the slide below.

SUNY 15 mph open prop
Are we supposed to include the “way out there” test runs (24 inches and 30 inches) when there were no strikes at 6 inches? If there was a strike at 6 inches and none at 12 inches, should we include the runs at 24 inches and 30 inches? Seems like they would just be improving the rating by adding more misses.
- Are we supposed to combine the “Round Ring” and “Hexagonal Ring” data to calculate the effectiveness of ring guards? Or were we just supposed to use the Ring Guard?
- We are unable to replicate the zero rating assigned to all guards at 15 mph because we cannot see the number or runs and the number of strikes at 15 mph. However, Table 4 has all zeros at 15 mph for the guards. Earlier versions of the protocol marked the 15 mph runs as “Blunt Trauma” for the guards. Looks like they since decided to mark them as zeros and do not explain that change in the procedure.
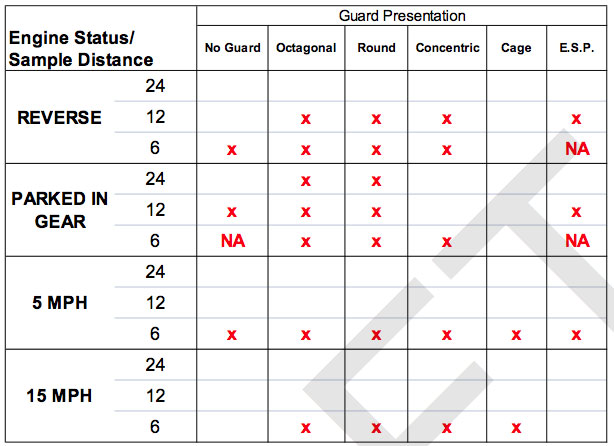
- The Guard Presentation Summaries just noted if there had been a strike at that distance or not, now how many strikes there were, or how many runs there were:

CED Propeller
Guard Human Factors Test Results
Our efforts to duplicate Table 4 were extremely frustrating.
We searched back through the many earlier reports and could find no listing of the number of runs and the number of strikes for each guard at each distance.
We strongly suggest ABYC release a table for each guard listing the number of runs and the number of strikes in each situation (reverse, parked-in-gear, 5 mph, 15 mph). At the moment we are just being asked to to take their word for Table 4. All the unknowns and challenges we identified above in trying to replicate Table 4 is not acceptable.
Possible Error Identified in Effectiveness Table 4
Note – we recognize the calculations below are based on our incorrect interpretation of run counts.
Even though we were just stumbling around trying to replicate Table 4, we seem to have found an error. Using our one dash equals one run theory to calculate the 5 mph Rating for Concentric Ring Guards per the 5 mph Concentric Ring image below:
SUNY test Concentric Ring 5 mph
Calculating for 5 mph (see the 5 mph SUNY image above)
there were a total of 5 runs, 4 of them were struck
4/5 = 80 percent
80 percent corresponds to a rating of 0 per page 13 of the procedure BUT we see a 3 in that square on Table 4 on page 13 (Concentric at 5 mph)
It certainly looks like the Concentric Ring 5 mph test (see image above) indicates minimal protection at 5 mph.
Even though we know our numerical calculations above are wrong (one dash does not equal one run), its hard to believe the performance of the Concentric Ring at 5 mph shown in the image above rated the highest level of performance at 5 mph. It looks like all the runs at 6 inches at 5 mph were struck by the propeller. How is it possible for that performance to achieve the best rating?
Even if three runs were struck at 6 inches and three runs were missed at 12 inches, the best it could have done is 50 percent which corresponds to a Rating of 2. In general, we do not envision them making all three runs at 12 inches if one of the first one or two were not struck. That would lead to a percentage greater than 50 percent or a Rating of 1 or 0.
Was the Propeller Powered During the Effectiveness Tests?
In the 1990 SUNY testing the outboard was NOT powered. They just drug it around the circular track with the rotating arm.
If you “start” the drive by running its engine, it creates exhaust and noise. If you dump the exhaust through the prop hub into the tank you create a big mess very rapidly (no more pretty underwater pictures in blackened water). If you port the exhaust out of the engine to a pipe to externally exhaust the gas outside the building somewhere you create back pressure on the engine, have problems keeping the piping from getting wound up as you go around the tank, and no longer have the effect of the exhaust coming out the propeller hub which has some effect on the flow patterns behind the propeller.
We think it was just drug around by the rotating arm in the current testing as well, but cannot seem to confirm that from the current procedure or any previous versions of it.
A few images of the September 2010 IBEX report show air, exhaust, or something coming out the propeller during the current SUNY testing, such as the Parked-in-gear Unguarded propeller image below.
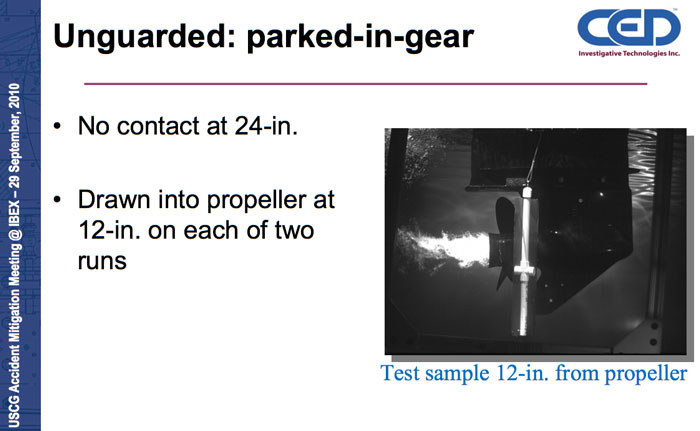
SUNY Parked-in-Gear Open Propeller
They may have just allowed air to enter the exhaust passages and be drawn through as the drive was drug forward, however the parked-in-gear image should have been taken at very slow to no forward speed.
They may have powered the drive with an electric motor?
If the drive was powered by its gasoline engine, how fast was the engine turning? Are the drive manufacturers now admitting their propellers turn when the drive is in neutral / park? Or is any inflow in park supposed to be resulting from suction created by the exhaust gas exiting the prop hub?
If the propeller is just windmilling while the rotating arm drags the drive around the track, the inflow flows and pressures around the propeller guard that help determine whether the guard strikes the “sample” are much different than if the propeller was powered.
If the propeller was powered, we see no mention of engine RPMs or prop RPM other than making guesses at prop slip for 5 mph or 15 mph (but propeller pitch is not provided either). No RPM (or speed) is provided for reverse, and the same for parked-in-gear. If the prop is turning, how fast is it turning? Is it being powered?
Some of these tests (parked-in-gear and reverse) look potentially doable in the open water or suspended over a large tank, however, to match the SUNY results the same procedure would need to be followed.
There are far too many unknowns in the procedure for it to be repeatable by others.
Important Point – If you asked several boating industry people read the procedure for rating effectiveness, then asked them if the outboard motor was powering the propeller during the effectiveness testing, we suspect most would say yes. If the outboard is not powered and the document does not clearly state that, it is misleading.
Guards Are All Rated 0 at 15 mph
The Procedure tells us to calculate the percentage of strikes at each speed and use the lookup chart to find the Rating. All the values in Table 4 for guards at 15 mph are 0. Some earlier versions of the procedure talked about rating all the guards as “Blunt Trauma” at 15 mph. Then the October 2012 Rough Draft that was recalled included this sentence, “Therefore, based on the CRESE testing, it was agreed that for speeds of 15mph, the rating would be “0”.” It looks like they incorporated this sentence into Table 4 without telling us.
Are Higher “Ratings” Better or Worse?
For a while, we thought some of the Ratings (speed, maneuverability, installation, effectiveness) were better for larger Ratings (such as a 3) and others were better for smaller Ratings (such as a zero or 1). It would have reduced our frustrations if it had been explained up front that for every Rating, the larger the rating, the better the guard.
What Happened to Protection in Reverse?
Combining Parked-in-Gear and Reverse to form the new “Boarding” Rating means Reverse no longer has its own rating. Protection in reverse is critical in some situations (like rental houseboats). Now a marina looking for a rental houseboat guard might avoid ring guards due to the low Boarding rating, but not be aware a ring like Guy Taylor’s 3PO guard with the optional flip up shield does provide protection to the rear, and probably does so with less drag (less fuel consumption) than some other alternatives.
How Many Runs Are We Supposed to Make?
We see no protocol for determining how many runs to make as which distances (6, 12, 24, 30 inches).
We anticipated seeing a protocol that defined how many runs to make at which distances similar to the one below we just made up:
PGIC Made Up Protocol For Determining How Many Runs to Make at Each Distance
Make 3 runs at 6 inches, then two runs at 12 inches. If no strike at 12 inches during the first 2 runs, stop the test.
If there was a at least one strike in the first two runs at 12 inches, do a third run at 12 inches, then two runs at 24 inches. If no strikes at 24 inches, stop the test.
If there was a strike in the first two runs at 24 inches, do a third run at 24 inches, then two runs at 30 inches. If no strikes at 30 inches stop the test.
If their was a strike in the first two runs at 30 inches, do a third run at 30 inches.
We are not saying the protocol we just outlined is the best one, we are just saying a protocol of that nature needs to be included in the Propeller Guard Test Procedure.
Are we supposed to go all the way out to 30 inches for each guard? In general, it looks like they kept going up in distance until there were no more strikes. But why did they go all the way out to 30 inches for the unguarded propeller?
Were All Three Sample Sizes Used in Calculating the Ratings?
Testing began with the three inch diameter 16 inch long samples. In December 2010 testing, some samples were 3 inches in diameter and 16 inches long, others were 10 inches in diameter and 16 inches long, and still others others were 10 inches in diameter and 30 inches long. Were runs using these larger samples included in the Ratings?
If the 10 inch diameter sample runs were included and they were hung at the same distances as the earlier 3 inch diameter samples, their diameter alone would place them 3.5 inches closer to the propeller or guard. (3 inch diameter has 1.5 inch radius, 10 inch diameter samples have 5 inch radius, 5 inches minus 1.5 inches equals 3.5 inches closer).
When Do We Use Horizontal Samples in the Effectiveness Test Runs?
Horizontal samples (aimed end on at the propeller as seen in the Concentric parked-in-gear image below) were used in some tests.
SUNY Concentric Ring parked-in-gear
Were results from the horizontal sample test runs included in calculating the Ratings? How do we decide when to use horizontal samples?
If horizontal sample runs were used in Rating the Concentric Ring Guard, why were not used in Rating the unguarded propeller?
Unguarded Propeller Effectiveness Testing Gets a Break
We are obviously pretty sensitive to how guards are tested against open propellers.
Looking at the September 2010 IBEX presentation, open propellers were not even tested at 6 inches during the parked-in-gear test (see below).
SUNY parked-in-gear open propeller
We also notice that in most of the guard tests, when the sample was struck, they include some dashes explaining the brutality of the strike (as seen in several examples on this page: Gel split, Gel split to core, Gel tearing, Multiple pieces, Chunks, PVC core removed, etc.). In the unguarded propeller parked-in-gear test, they just say two of the samples were drawn into the propeller. The difference between the description of samples struck by a guard and the description of samples struck by an open propeller reads a little like it was “edited”.
Cage Guards Pushed Samples Out of Way at 5 mph
In the Listman case the industry was arguing that at speeds above 3 mph guards could fracture human skulls. Yet in this test, ballistic gelatin was not even marked when struck by a cage guard at 5 mph at 6 inches or at 12 inches from the centerline of the propeller. We thought these findings were of interest, but no elaboration was made of them.
Why is Data Being Collected That is Not Used in the Ratings?
The speed test requires collecting speed and RPM data at every 500 RPM and at maximum RPM. It appears like the maximum RPM speed data is the only data point used in calculating the Speed Rating. Why collect the other data? The procedure also tells you to calculate the differences in speeds over the full range of RPM settings and convert the differences to percentages. The procedure similarly instructs you to calculate the percent difference in maximum trim angle over the full range of RPM. If these calculations are not part of the Rating, what are we performing them for?
Similarly, the maneuverability test requires collecting pitch and roll angle data over the course and performing several calculations with them, however the maneuverabilty rating is solely dependent on steering torque.
Why collect this other data if it is not part of the Rating? We recognize the importance of some of these variables. However the task at hand appears to be to put a numerical Rating on a guard for speed, maneuverability, installation, and effectiveness. We do not understand why we are collecting data on these other variables and then not using it.
Summary of our Frustrations With the Numbers / Ratings Surrounding the Propeller Guard Test Procedure
- Our inability to reproduce effectiveness Rating Table 4.

USCG Propeller Guard Test Procedure Table 4
- We cannot see results from the individual effectiveness test runs or run counts and strike counts by guard type and run type (15 mph, 5 mph, parked-in-gear, reverse).
- We cannot see which test runs were included in the ratings (test runs made on multiple occasions with multiple sample diameters, with multiple sample lengths, with vertical or horizontal samples, and with samples at multiple distances). Which ones are we supposed to count?
- We cannot tell if the Round Ring and Hexagonal Ring data were combined for the Ring effectiveness rating or not.
- Following the process outlined in the procedure results in nonzero ratings for some of the guards at 15 mph. However, Table 4 has zeros in all guard entries for 15 mph without any explanation. Yes, we suspect it is due to blunt trauma issues discussed in previous versions of the procedure, but the current procedure says nothing about them. Page 20 of the Procedure says:
“Following the test runs, analyze the number of test sample strikes during each speed run to develop a profile as described in Paragraph 8.5.1 of the Propeller Guard Test procedure. Propeller Impacts with test samples are considered as injury producing events, and the percent of injury producing events relates to the effectiveness ratings, 0 – 3.”
It says nothing about automatically adjusting all 15 mph guard Ratings to zero.
- We found what appears to be an error in the effectiveness rating of the Concentric Ring at 5 mph but have no way to confirm it other that ask ABYC to look into the data we cannot see and calculate it again.
- We cannot tell if the propeller was powered during the testing or if the rotating arm was just swinging the drive around the tank while the propeller windmilled. That should be expressly called out in the procedure.
- If the propeller was powered by the outboard engine, we cannot tell what was done with the exhaust (blown out the prop hub?) which impacts flow around the guard.
- The Rating for reverse has since been integrated with the Rating for parked-in-gear to be the new Boarding Rating. An specific rating for reverse would be very useful for some boat types (like rental houseboats).
- The procedure does not provide a protocol for determining how many runs to make at each distance during the effectiveness testing. The number of runs made at each distance can drastically effect the Rating (make lots of runs at large distances and only a few at close distances and the guard rates well).
- The procedure does not provide a protocol for determining when to use horizontal samples during the effectiveness testing. If horizontal samples had been used in the testing of unguarded propellers, the ratings might have changed.
- Samples struck by guards are written up like utter mayhem (Gel split, Gel split to core, Gel tearing, Multiple pieces, Chunks, PVC core removed, etc.), while samples struck by open propellers are described as “drawn into propeller”.
- Our ever present comment of no boat being used during the effectiveness tests. Flow around the hull impacts flow around the propeller and guard, thus it impacts which samples are struck.
- We found it unusual that any sample marked (barely blemished) during the effectiveness test was counted as a strike (those barely blemished received the same score as those that were totally obliterated.
Our Previous Posts on the new Propeller Guard Test Procedure
We previously posted:
- Propeller Guard Test Procedure Released by U.S. Coast Guard
- USCG Propeller Guard Test Procedure – an initial review