Outboard Motor Log Strike Mode by Speed and Resistance to Impact Chart
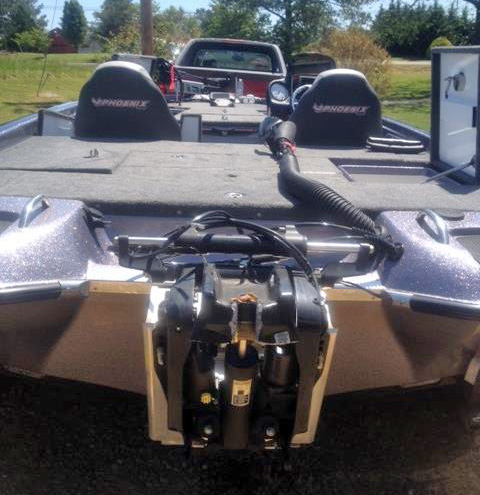
Pro angler, Rex Chambers’ boat with outboard motor broke off
We previously posted information on several existing and proposed solutions, including The Leash, a vectran tether targeting bass boat applications.
Submerged objects have a wide range of characteristics ranging from almost pure water with just a few weeds or small pieces of debris all the way up to stumps, pilings, dredge pipes, railroad ties, and concrete piers. When outboard motors from various manufacturers of various sizes and speeds strike this wide range of objects, the outboard motor log strike system behaves in a number of different ways (modes).
Especially of interest are outboard motors that break off the boat. Breaking off the boat is a prerequisite to breaking off and flipping into the boat. Not all outboards that break off will flip into the boat. But for an outboard to pass over the rear deck, and enter the seating area of a bass boat, it must first break off the boat.
The Outboard Motor Log Strike Modes Chart for a bass boat below illustrates the range of behaviors (modes) encountered.
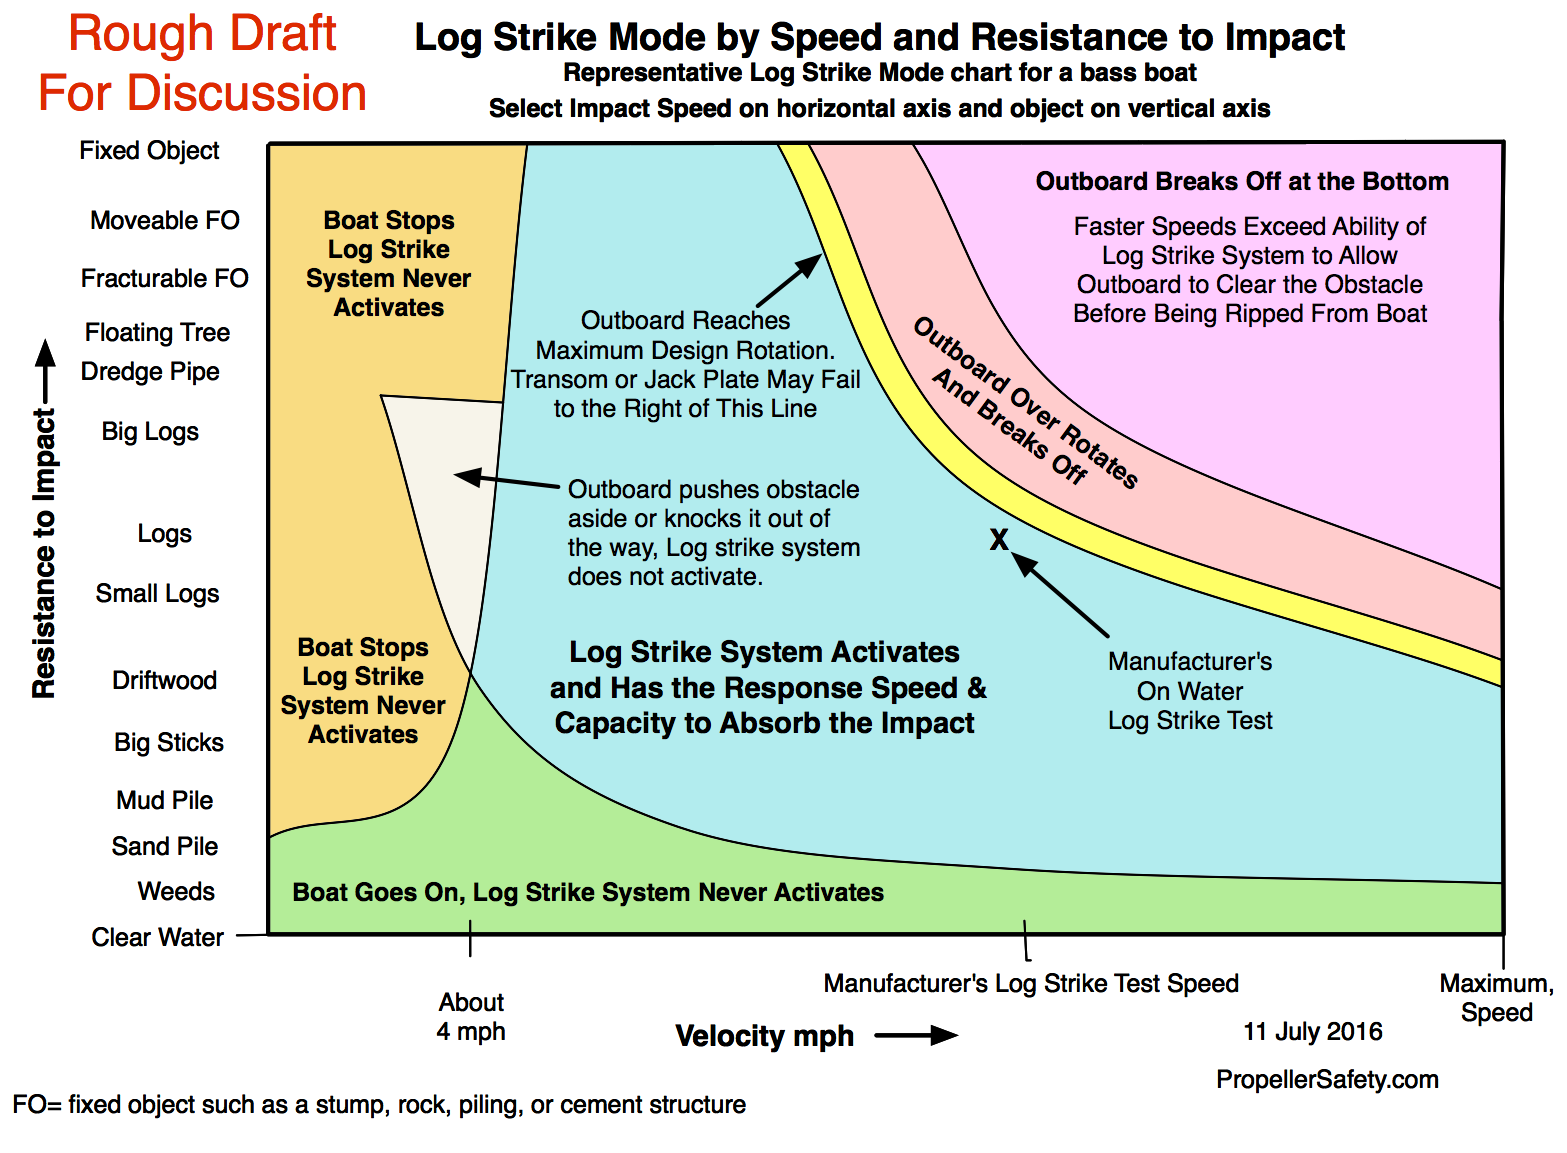
Outboard Motor Log Strike Modes
Click anywhere on the chart above to view a much larger version of the same chart on a large monitor.
NOTE – this chart is obviously NOT PERFECT, it has been posted to stimulate discussion, encourage development of additional solutions, and the further refining of existing solutions. The vertical list of struck objects on the left axis may not be in the correct order and they are certainly not correctly spaced along the vertical axis. Similarly the curves drawn serving as boundaries for the various modes are obviously not exactly where they should be for any specific vessel or outboard motor. The chart depicts generalities.
USING THE CHART – select a bass boat speed and a submerged object to be struck at that speed. Where those two lines intersect is a point on the chart. See what mode (color) that point is in. The chart generally predicts what will happen if you strike that type of submerged object at that speed in a bass boat. Yes we know the horizontal axis mostly displays relative speeds, not specific speeds.
PURPOSE OF THE CHART – the impact of existing and potential solutions to the problem can be envisioned on the chart (how the boundaries of the various mode areas would change with application of certain design changes or mediations). This will be further discussed later in this post.
Comments Invited – We welcome your comments and suggestions about the chart and the modes it illustrates. Please help us improve the chart.
General Discussion of the Modes
- Boat Stops – vertical mustard colored area along left side of the chart. The boat does not have enough energy to continue forward, it just stops leaning into the object with the propeller still spinning, or choked in weeds.
- Boat Goes On – light green area at bottom of chart. No significant resistance is encountered. The boat continues forward and the log strike system never activates.
- Outboard Pushes Obstacle Aside or Knocks it Out of the Way – gray colored area to left middle of the chart. The boat has enough energy to push the obstacle out of the way, the log strike system is not activated. The outboard just shoves the obstacle out of the way and goes on. The boat is not yet going fast enough to trip the log strike system.
- Log Strike System Activates and Has the Response Speed and Capacity to Absorb the Impact – large light blue area in middle of chart. All is well. The log strike system deploys, the outboard motor kicks up over the obstacle and then settles back down to its previous position (trim).
- Outboard Reaches Maximum Rotation Line, left border of thin yellow band near middle of chart. Once maximum design rotation of outboard is reached, outboard, transom, and jack plate flex some more before something finally gives either in the yellow band (Jack Plate or Transom) or to the right of the yellow band (outboard over rotates and breaks off).
- Outboard Over Rotates and Breaks Off – pinkish band in upper area of the chart between the yellow band and the violet upper right corner of the chart. The outboard has rotates beyond its design limit and breaks off or the transom or the jack plate fail.
- Outboard Breaks Off at the Bottom – light violet colored area in top right corner of the chart. The log strike system is not able to respond fast enough to allow the outboard to clear the obstruction before it breaks off. This is the area two stage tilt cylinders were designed to protect (lower resistance from log strike system until the outboard clears the object, then resistance increases to absorb the energy of the the upward swinging outboard motor). The jack plate or transom may also fail in this area. The outboard may break off after the outboard clears the obstacle but before the outboard reaches the top of the swing as parts fail sequentially along the way. The geometry of the outboard changes as it rotates, dynamically influencing the forces, stresses, and strains on various components.
Log Strike Test
One way to explore the chart above is to think about an outboard motor manufacturer conducting an on water log strike test. Several outboard manufacturers are known to have or to continue to conduct on water log strike tests including: Outboard Motor Corporation (OMC), Mercury Marine, Yamaha, and Suzuki.
Each manufacturer had/has its own procedure in terms of boat speeds and log specifications, but generally, they ran over floating logs of a certain diameter and length at a certain speed to prove the durability of their outboards.
An “X” is on the chart about halfway vertically up the chart to the left of the yellow band. An arrow indicates it is a Manufacturer’s On Water Log Strike Test. A manufacturer chooses to hit a certain type (like pine), diameter, and length log at a certain speed.
If you look at that test point, it is in the blue area, the area in which the log strike system is activated, absorbs the energy of the upward swinging outboard motor, and the outboard returns to its previous trim position.
Now if you imagine hitting the same log (same length and same diameter log of same type of lumber) at slower speeds, you can just look along the chart directly to the left of the “X”. The log strike system continues to function perfectly as slower speeds down till where you eventually are in the gray area (boat has enough energy to push submerged object out of the way) or all the way over to the mustard colored area where the boat just stops and the prop continues to turn).
Similarly, if you imagine hitting an identical log at faster and faster speeds, you can see that is you strike the log just a little faster, the jack plate or transom may fail, or if you strike it yet a little faster, the outboard may over rotate and break off.
If you strike an identical log even faster at near maximum speed, the outboard motor breaks off at the bottom of its upward swing (is unable to clear the object before it is ripped off the boat or breaks off before the top of its swing)
The chart below shows what happens in the discussion above AND if you stayed at the same speed used during the log strike test, but struck more solid objects than the test log specified in the test procedure.
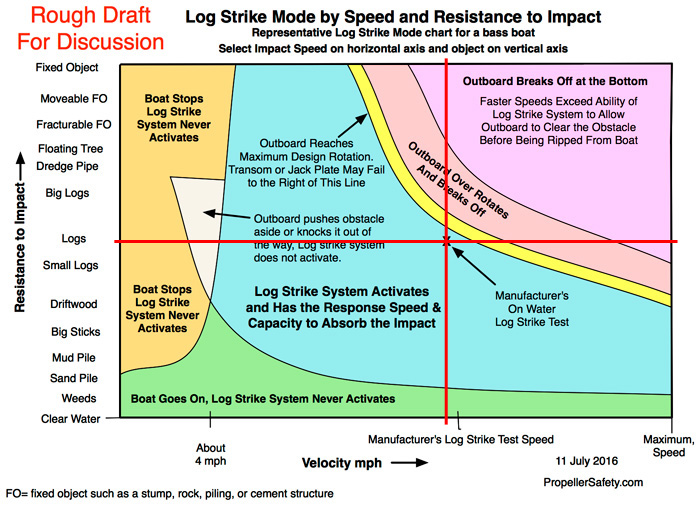
Outboard Motor Log Strike Modes – marked up
As to striking more solid objects, you can see that striking an object just a little more solid or heavier object than the test log (moving a little ways vertically up the red line from the “X” into the yellow zone) could bring about jack plate or transom failure.
Similarly, striking an object a little more solid than the test log at the same speed (moving further vertically up the red line from the “X” into the peach colored zone) could result in the motor over rotating and breaking off, and striking a fixed object at the same speed (moving still further up the red line from the “X” into the lavender colored zone) could result in the outboard motor breaking off before or shortly after it clears the submerged object.
Potential Design Changes and the Chart
We find a printed off copy of the chart to be extremely helpful in thinking about or describing the difference some change (change in speed, change in object struck, change in mitigation methods, change in outboard) would have on a collision with a submerged object.
A few design changes or mitigations will be discussed here with respect to how the chart would change (change in performance of the system vs. velocity and object struck).
1. Stronger components – solely making the components stronger (thicker or from stronger materials), makes the yellow band wider (stretches further up and to the right) and pushes the pink and light violent colored areas further up and to the right. Use of stronger components prevents some combinations of boats, speeds, and submerged obstacles from breaking off that otherwise would have.
Once the outboard reaches the top of its designed swing, the additional strength allows the parts/components to absorb more energy before breaking off at the top. If the vessel is going faster, the additional strength allows the parts/components to absorb more energy before breaking off at the bottom. (meaning many outboards will not break off at all because the vessel is not going fast enough to create enough energy to break them off).
Taken to its full extent, components (including the transom and jack plate) can be made strong enough to prevent the outboard from breaking off at all. In this instance, the yellow band would extend all the way to the top right corner. The light pink and light violet modes (broke off at top, and broke off at bottom) would not exist. However, part/component weight and size make it more practical to consider the entire system and combine increasing component strength with other mitigations.
2. Increase tilt cylinder internal relief valve pressure setting. If the relief valves can open fast enough, this will push the left border of the yellow band up and to the right. Outboard motors will have to be going faster when they strike submerged objects to reach maximum rotation (maximum tilt).
Other changes with Approach #2 – The blue area now extends further over and up. The log strike system can dissipate more energy. But, it must be strong enough to not break off, and the adjoining components including the jack plate and transom must be strong enough as well. When striking fixed objects, the outboard may break off at slower speeds, the left border of the violet area may move down and to the left because it is harder for the outboard to clear a fixed object at speed.
3. Increased capacity log strike tilt cylinder – If the hydraulic tilt cylinder has a larger diameter, the same stroke, a larger diameter cylinder rod, and internal relief valves that open at the same pressure as before, the tilt cylinder will absorb more energy (more force over the same distance). Meaning some strikes that previously caused the outboard to reach maximum upward designed swing (maximum tilt) will not longer reach maximum tilt, and will not break off. This means the yellow band remains somewhat similar in width, but is pushed up and to the right. Also see “Other changes with Approach #2” above as they apply to this approach as well.
3. Two stage tilt cylinder – tilt cylinders designed to allow the outboard to clear the obstacle with little resistance to its upward swing, then quickly cushion the remainder of the outboard’s upward swing. Two stage tilt cylinders primarily move the light violet area upward and to the right. Depending on the response times of the internal relief valves and their overshoot characteristics, they may also move the left border of the yellow band up and to the right. Some two stage cylinder designs only try to cushion the tilt cylinder near the very top of its stroke (less shock when hits upper limit of stroke.)
4. Limiting maximum boat speed (like PWCs do) moves the vertical maximum speed line to the left.
5. Use of tethers – tethers have no influence on the modes or the chart. They only prevent the outboard from flipping into the boat if it breaks off.
6. Break away lower unit – the lower part of the outboard beneath the power head (engine) is designed to break away in severe collisions. This approach has no influence on the chart. It only prevents the outboard from entering the boat if it breaks off.
7. Additional internal relief valves in the tilt cylinder – depending on sizing and other characteristics of the relief valves, adding more reliefs could reduce maximum overshoot (peak pressure) in the tilt cylinder when striking fixed objects. This would move the left edge of the violet area up and to the right. Similarly, it might also move the left edge of the yellow area and the left edge of the pink area up and to the right. (some outboards currently over rotating may be doing so because they received additional energy in the collision because the log strike system was slower in clearing the submerged object because of relief valve overshoot.)
8. Crush tube – adding a crush tube (piece of tubing designed to be crushed to absorb energy) internally in the tilt cylinder or externally, near the end of stroke of the tilt cylinder could greatly reduce shock loads resulting from the upwardly swinging outboard reaching maximum tilt. Adding a cushion to the hydraulic cylinder could have a similar result. Either approach would require other components to be strong enough to take the loads. However, those loads would be lower than they now are because the tube or cylinder cushion would be dissipating the energy over a longer period of time.
9. Smaller horsepower outboard – a smaller outboard would speed limit the bass boat (see item #4) plus lower the mass of the rotating outboard, placing less load on the jack plate and transom during impacts at the same speeds, plus be easier to restrain (tether). The maximum speed (right side vertical axis of the chart) would move to the left. The chart would change (modes) based on the physical characteristics of this new lower horsepower outboard and its log strike system.
Previous Posts
A couple previous posts especially provide ideas when thinking about the “Modes” chart above.
- Design Chart for Preventing Outboard Motors From Entering Boats
- approaches to prevent outboard motors from flipping into boats
Future Revisions
The chart may be subject to multiple revisions in the future, but even in its current form, we think it can be a very useful tool in discussions of the problem, of the scenarios, of log strike testing, of specific accidents, of specific mitigations, and of the need for fail-safe testing.
Comments
As mentioned earlier, we especially welcome your comments on this chart and any ideas you may have for improving it.