Analyzing Boat Acceleration & Boat Coast Down Data
This paper develops a new mathematical model for how boats accelerate during a high speed test run. The process divides a top speed run into two segments, namely a displacement segment and a planing segment. The equation only requires three coefficients for each segment. Each coefficient is independent of the others. Additionally, each coefficient has a meaningful value tied to an attribute of the data. A version of the same model applies to boat coast down data. Previously, some have used polynomials with meaningless coefficients to curve fit coast down data.
This work has been a monumental project on our side. I worked on it off and on for over thirty years.
We hope this report brings new insights to the math and physics behind how recreational boats accelerate and coast down (decelerate). Applications include comparing performance of one boat to another or to itself with modifications. The model identifies differences in performance and the magnitude of those difference. It can also be used to show when those differences occur during a top speed run.
Only a small fraction of the entire report is discussed in this post. We encourage you to read the entire report which is available below.
About This Document Itself
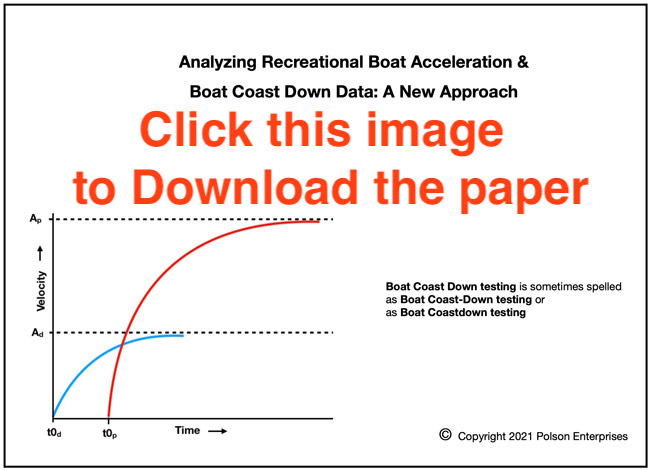
Note: Coast Down Testing is sometimes spelled as Coastdown Testing or as Coast-Down Testing.
This work recently inspired us to digress and take on a spin off boating safety project. Hopefully it will inspire others to do the same.
The document itself is 142 pages in length and about 5 megabytes in size. It contains over 50 images, many of which portray data from actual test run data.
The full paper is best viewed on a large desktop computer monitor.
We hope this paper:
- Will inspire others to build upon it
- Is useful to those professionally testing boats as well as the average boater
- Inspires projects that will make boating more fun
- Inspires projects that will make boating safer
- Plants a few ideas some will later apply in other fields of endeavor
Safety Disclaimer
To those motivated to collect boat test data and replicate our findings, you do so at your own risk. We assume no liability for anyone attempting to collect similar data. We refer those thinking about it to page 99 of our paper for some safety information.
A VERY Quick Introduction to the Method
Step 1 – A boat is tested. It is ran from being at rest to top speed while velocity data is collected several times per second.
Step 2 – Plot the Velocity Data.
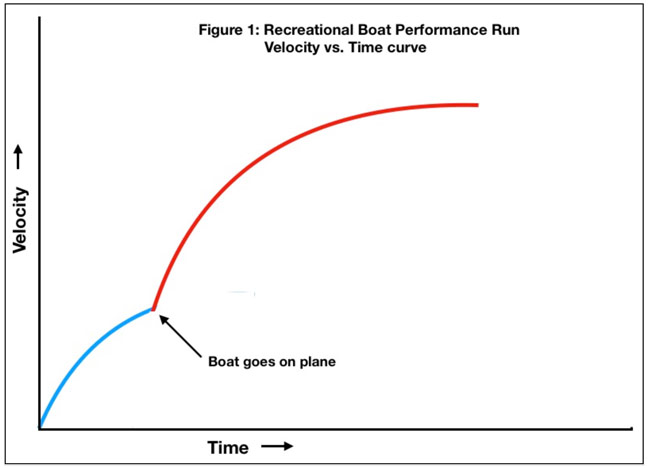
Boat Acceleration Curves – top speed run
Most planing boat top speed run velocity curves look something like the curve above. The boat accelerates from zero in displacement mode. The actual acceleration at time = 0 is equal to the slope of the velocity curve at time = 0. Next the boat transitions to planing. Then it accelerates again, eventually reaching top speed.
Step 3 – Envision both curves above beginning at the x axis, arcing upwards, and extending to the right. The curves you are imagining would look like the curves in the image below.
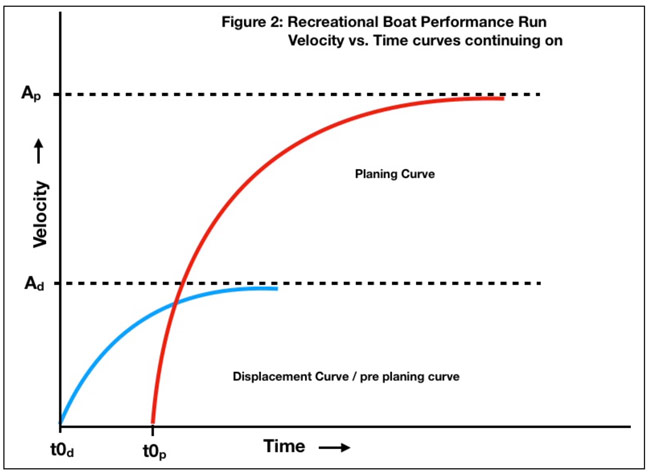
Full Boat Acceleration Curves – top speed run
t0d represents the moment the boat was thrown into full throttle and began moving in displacement mode.
t0p represents the theoretical moment the boat would have been thrown into full throttle if it had actually taken off in planing mode instead of displacement mode.
The portion of the planing curve (red curve) that lies below the blue curve (displacement curve) represents a virtual path that did not exist in real life. However, it is import in modeling the curves.
Creating the Model
We curve fit the data for blue displacement mode curve portion of a top speed run. Then we curve fit the data for the red planing mode curve portion of the top speed run (the portion of data above the blue curve).
We found both curves could be fit with an equation of nature of:
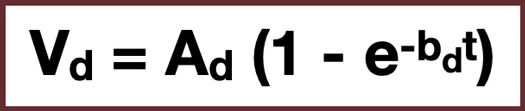
Boat Acceleration Mathematical Model
The particular equation above has “D” subscripts and represents the displacement portion of the top speed run.
Vd = Velocity
Ad = the top speed of the boat would reach in displacement mode if it ran forever
bd = a measure of how quickly the boat decelerates
e = a scientific constant equal to approximately 2.718, the natural logarithm of e or ln(e) = 1
t = time
Planing Portion of Top Speed Run
An identical equation with “P” subscripts represents the planing portion of the top speed run.
Figure 26 shows how we used Curve Expert Pro to curve fit the planing portion of a top speed run. It also shows how closely this model fits the actual data.
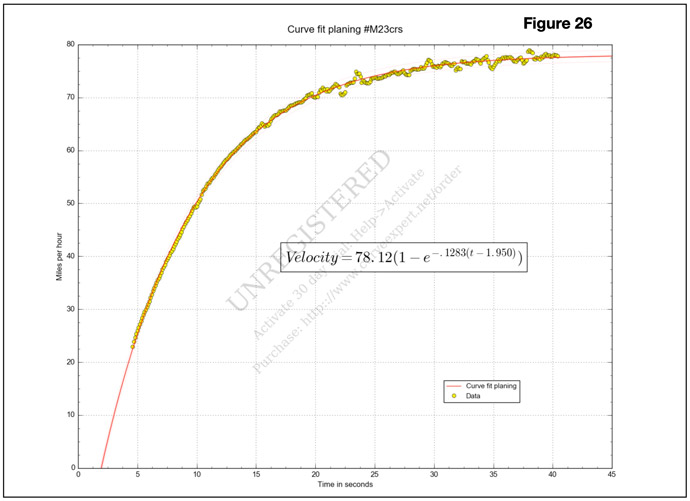
Planing portion curve fit PDL chart
Representing a top speed run in this manner with a total of 6 coefficients brings many things to the table. For example, it allows top speed to be accurately estimated from just a snippet of data from the planing portion of the curve. This is important in situations if which a test crew wants to know the top speed of the vessel for comparison to previous versions. However, they does not have:
- access to enough open water to run the boat to top speed,
- or proper safety equipment on site to run a fast boat to top speed,
- or a boat operator onsite experienced in operating a boat as fast as this vessel is capable of running
The process brought many other possibilities to the table. Among them are automatically identifying take off times and automatically identifying shift points of two speed transmissions.
Additional Insights can be gained from Top Speed Run data
Having discrete velocity data allow us to calculate total distance traveled (the integral of velocity), It also allows us to calculate acceleration (the differential of velocity or slope of the velocity curve).
Propeller slip is calculated from displacement (distance traveled) data during each time step.
Acceleration data provides a measure of what it feels like to be on the vessel as it takes off. It also provides insight into passenger stability during acceleration and deceleration.
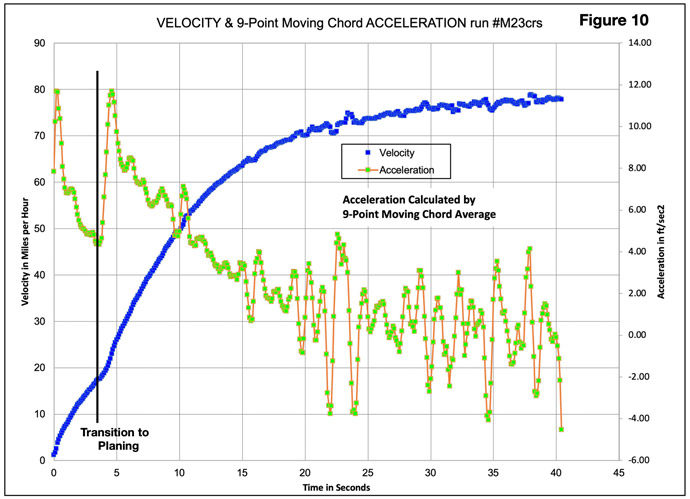
Velocity and Acceleration vs Time PDL chart
Figure 10 above plots Acceleration vs. Time. It provides a look at what happens in the transition zone from displacement mode to planing mode. The discontinuity about 3 seconds into the run is much more obvious than anticipated.
We determined acceleration multiple ways:
- by directly calculating slope of the velocity curve over each tenth of a second
- by using an algorithm to smooth velocity data, then calculate its slope each tenth of a second
- by curve fitting velocity data. Then mathematically differentiating the curve to determine acceleration each tenth of a second.
.
Planing Transition Zone
Figure 30 below provides an amazing look into how actual top speed run data transitions. It moves from displacement portion curve equation data points to planing portion curve fit equation data points as the boat moves through the transition zone. We were startled to be able to capture discrete data points so clearly showing this transition. It was as if we were looking through a microscope the first time.
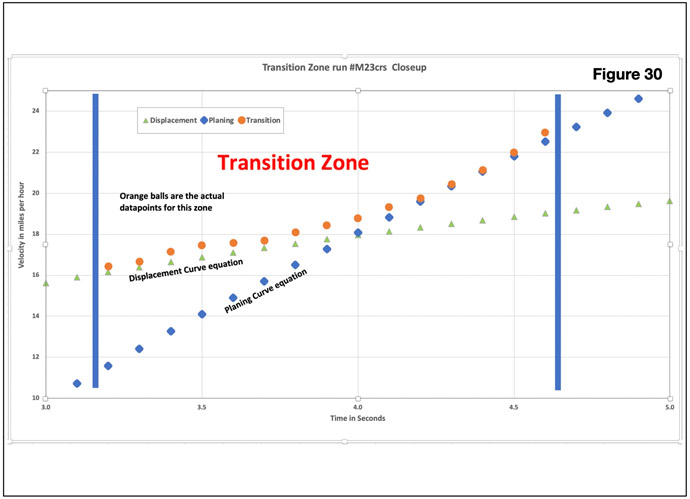
Displacement to Planing Transition Zone PDL chart
We calculated a time constant from “b”, one of the three coefficients. The time constant determines how how long it is going to take for the vessel to reach top speed.
Virtual Races
We started with velocity data each tenth of a second. We added up how far the boat moved during each tenth of a second at it current velocity. Then we added up all those distances. Now we know where the boat is down the virtual racetrack each tenth of a second. That allows us to virtually race one vessel against another. it also allows us to virtually race the same vessel against itself after a modification during testing.
Figure 33 below shows a high speed boat during a virtual race against a ski boat. The ski boat quickly accelerates and takes the lead. Over about the first 7.5 seconds the ski boat builds up about a 45 foot lead on the faster boat. At about 7.5 seconds the fast boat begins to go faster than the ski boat and gradually reels it in. The two boats are virtually running side by side at 12 seconds. Then the faster boat begins to pull away. The faster boat retakes the lead about 2 seconds later by about the maximum lead the ski boat had on the fast boat.
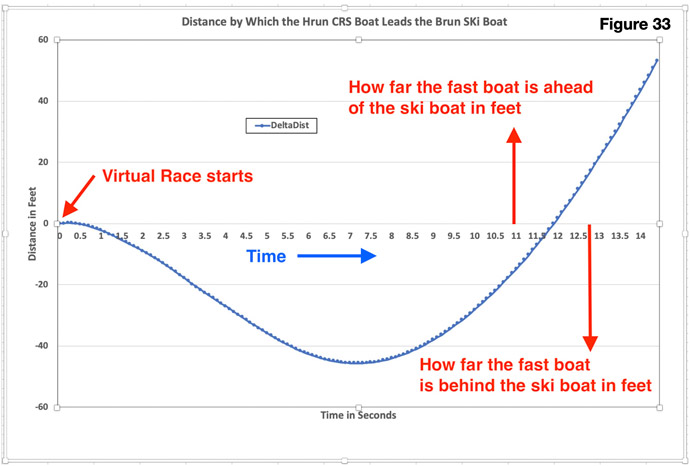
Virtual Boat Race PDL33
Figure 33 above displays top speed run data. It provides greater insight into how two top speed runs compare. Much more insight than just looking across at time to 20 mph, time to 30 mph, and top speed data.
Quick History of Coast Down Testing in General
Coast down testing has been performed on cars, semi-tractors with trailer, bicycles, and sport wheelchairs to estimate drag. The most simple method is to find a long, level, straight stretch of road (or gym floor for wheelchairs). Then get the vehicle to a given speed, shift to neutral, and see how far the vehicle coasts during coastdown. The further the vehicle coasts, the less drag.
Sport bicycle riders coast down test to see how changes in rider position / posture during a ride impact drag without using a wind tunnel. Some bicycle coast down tests have been performed in long hallways to avoid wind effects.
The Environmental Protection Agency (EPA) detailed vehicle Coastdown Testing Procedures in the Code of Federal Regulations. See CFR Title 40 – Protection of Environment Subpart D.
Society of Automotive Engineers (SAE) turns the coastdown concept around to estimate road load (the resistance supplied by the road). They conducting vehicle coastdown tests to determine road resistance. Then they program that resistance in to dynamometers for mileage testing. See SAE J1263 and SAE J2263.
Boat Coast Down Testing
Boat Coastdown testing is conducted by:
- running the boat up to top speed,
- quickly pulling the shifter to neutral,
- capturing velocity data while the boat coasts down to almost being at rest
A total run from zero to top speed and back to zero is shown in Figure B-1 below.
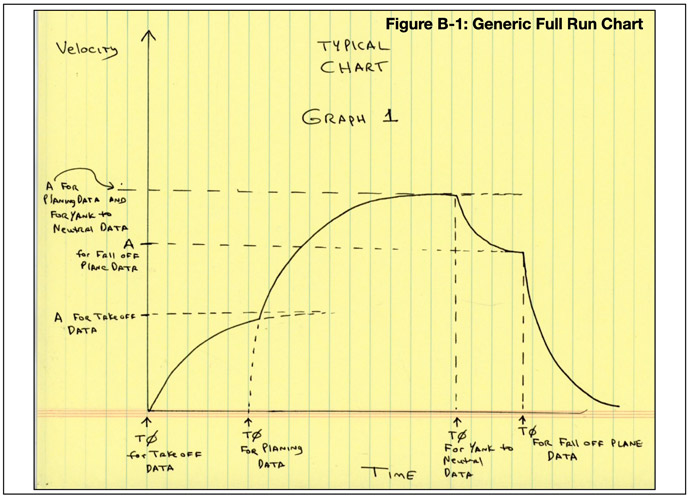
Full High Speed Run PDL chart including Coast Down
Just before the boat is thrown to neutral, all the force of the propeller is going into overcoming drag. When the boat is thrown to neutral, the boat begins to decelerate.
Force = Mass X Acceleration
Propeller force can be calculated from the mass of the boat (and all the stuff and people on it) and the deceleration at the moment the boat is thrown to neutral. If you know the prop thrust at top speed you also know the sum of all forms of drag at top speed.
You can see the effect of this drag in Figure B-4 below. About 20 seconds into the run the boat was no longer accelerating. The boat was slammed to neutral, propulsion force immediately went to zero, and drag quickly began to decelerate the boat.
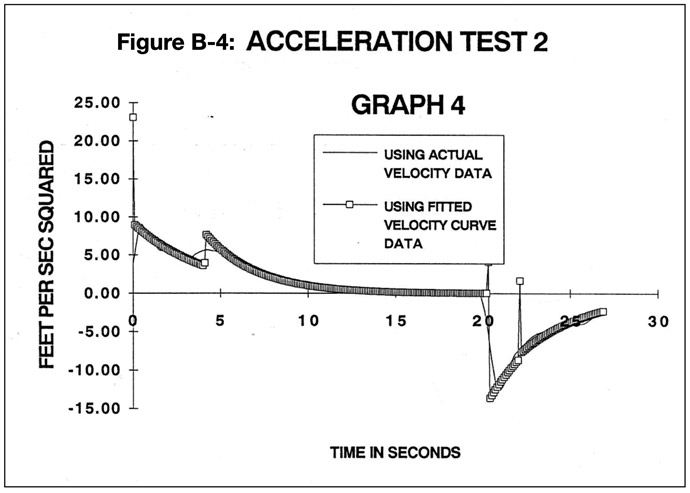
Full High Speed Run Acceleration including Coast Down PDL chart
Curve Fitting Boat Coast Down Test Data
Like before, boat coast down data was curve fit by an equation analogous to the planing portion of the top speed run curve. Coast down data was split between the planing portion and the displacement portion as the vessel coasted down. Each portion was best fit with a curve related to the curve we fit the top speed run data with. For example the planing portion of coast down data was curve fit with:
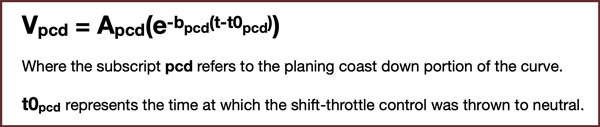
Boat Coast Down Equation
The other variables have the same description as before.
Vpcd = Velocity during planing portion of coast down
Apcd = the top speed of the boat prior to being thrown to neutral
bpcd = a measure of how quickly the boat decelerates during planing coast down segment
e = a scientific constant equal to approximately 2.718, the natural logarithm of e or ln(e) = 1
t = time
Additional insights can be gained from boat coast down data
We learned a few thing for those who try to replicate this work:
- Make sure your device for measuring velocity has a fast response time. It needs to accurately transmit velocity during take off and immediately after throwing the shifter to neutral. The pitot tube used in this experiment struggled with response times likely due to hose diameter and hose length. Now days GPS and other methods are available. See VBOX in the references below.
- Our paper reveals a smoothing algorithm I encountered long ago that did a nice job on smoothing velocity data before calculating acceleration
- Our paper reveals how we originally encountered the equations used to model boat velocity
Note this model does not specifically address added mass, the quantity of water being drug along by the boat. Others vessel performance models often represent added mass in some fashion in their models.
While our model is simplistic it provides great insights into many elements of boat performance.
We hope you find it useful.
Prior Work in This Field
- Towards Reconstructing Minimum Speeds in Recreational Boating Accidents. Bruce W. Main. SAE Technical Paper #950732.
Mr. Main conducted coast down tests to determine how far a boat would glide if it was pulled to neutral. As part of the project he captured velocity data each tenth of second and separately curve fit the displacement and planing segment of the data with polynomials. - Does a boat’s glide (deceleration) give a reasonable measure of resistance? Paddelite. BoatDesign.net thread including 23 posts in Hydrodynamics and Aeronautics. posted 5 May 2013.
- Measurement of Hydrodynamic Characteristics from Ship Maneuvering Trials by System Identification. Martin A. Abkowitz. Society of Naval Architects and Marine Engineers (SNAME) Transactions, Vol.88, 1980, pp.283-318. See pg. 311 for discussion of coast down testing of a large displacement vessel.
- VBOX Automotive supplies data loggers for use in coast-down testing and has some systems designed for marine use
- Our full paper contains many additional references of use to those researching this field
In Closing
This was truly a bucket list item for me.
A big thanks to all who helped to make this work possible. We hope you find it useful and enlightening.
We encourage your comments below.
If you read all the way down to here, please go back up near the top of the page and download the actual paper.